Data connection with
SQL
- Direct connection without detours — Connect your SQL database without additional middleware and access your data in real time
- Individual dashboards in the blink of an eye — Use complex SQL queries to present exactly the information you need — visually, interactively, and in corporate design.
- Don't just read data, write it — Edit data directly from your dashboard and easily write it back to your database.


Visualize SQL data live — without detours
With Peakboard, you can create your individual Create a SQL dashboard — quickly, visually and precisely tailored to your needs. Connect your data directly to Peakboard and visualize SQL data in real time, completely without middleware or complex additional systems.
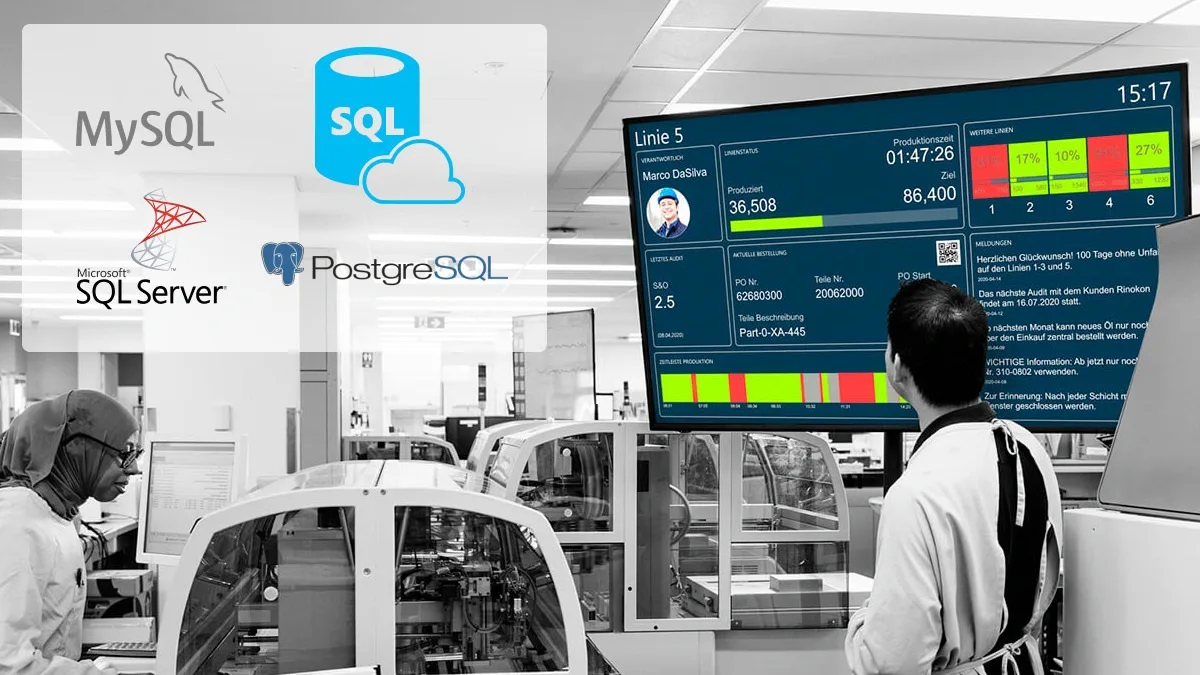
Supported SQL databases:
- Microsoft SQL Server
- MySql
- postgresql
- Azure SQL
Visualize SQL data—directly in the dashboard or in your own application
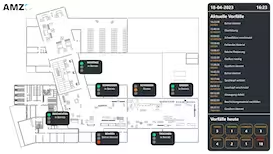
Whether simple tables or complex SQL queries — with Peakboard, you get exactly the data you need on your dashboard. You can combine data from various sources — such as production data, ERP systems, or quality indicators — and combine them in a single, clear interface. It doesn't have to be a classic dashboard: With Peakboard, you can create a fully interactive application on request — tailored to your requirements. Filters, input fields, buttons or live feedback turn this into a smart app that not only allows you to observe, but also actively control — directly on site, without programming.
Your benefits with Peakboard:
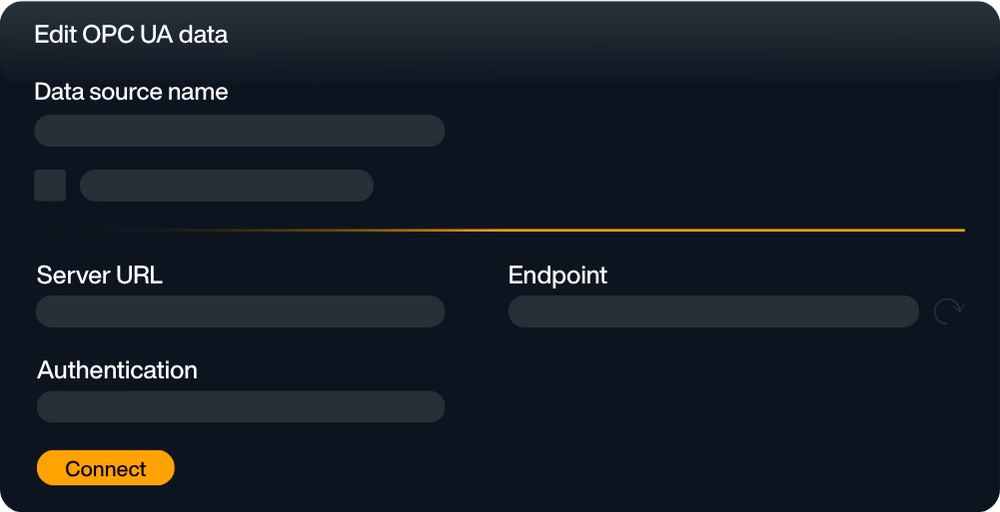
- Connect an SQL database directly — without detours, without additional effort
- View and write back real-time data — flexibly and securely
- Process complex SQL statements — easily thanks to the low-code editor
- Create a dashboard in corporate design — interactively and individually
Write back SQL data — directly from the dashboard
With Peakboard, you can not only read data, but also Write back SQL data. This makes your dashboard an active control tool for your processes — without any additional tools.
Start now for free with Peakboard Designer
Capture, process and visualize production and order data in real time — simply and without programming knowledge.


All of your data.
Peakboard connects your systems and brings all data to one platform — for visualization, automation and individual applications.


%201.svg)


%201.svg)


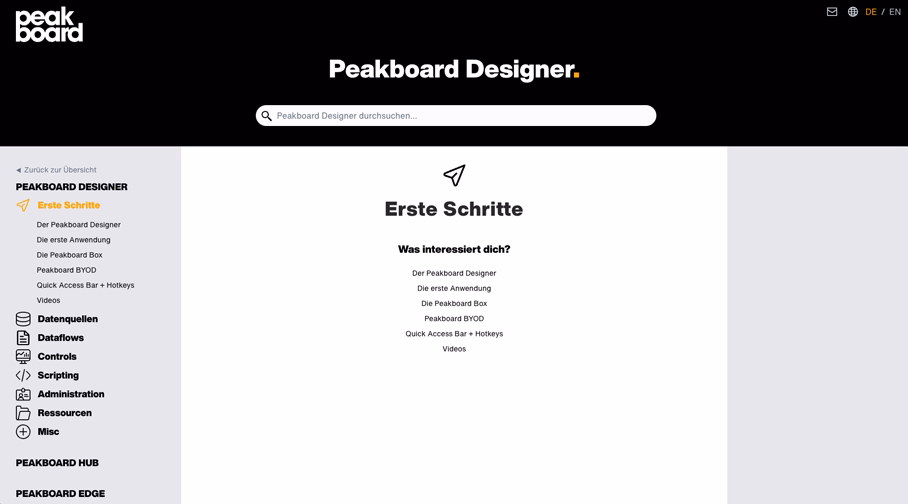
More information
for your start with Peakboard.

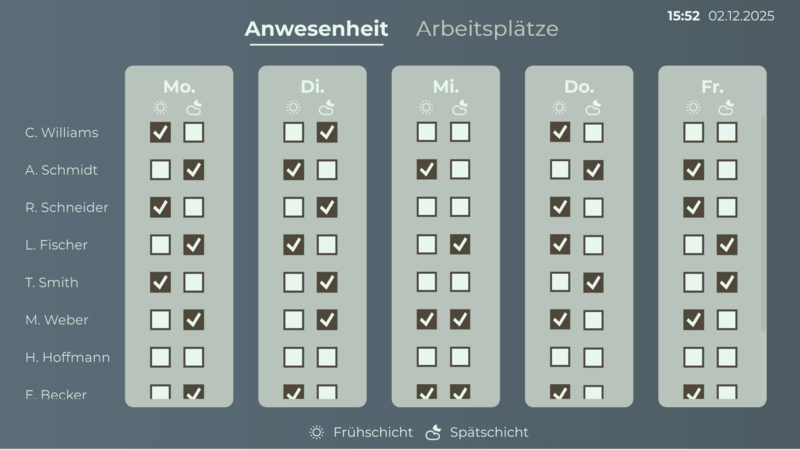
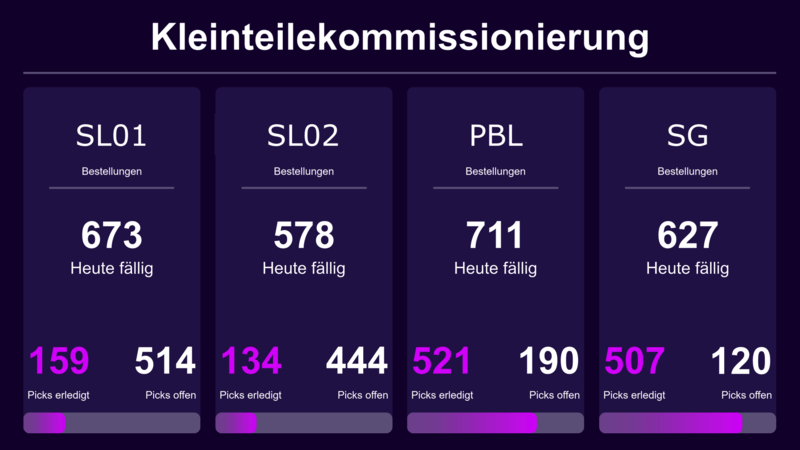
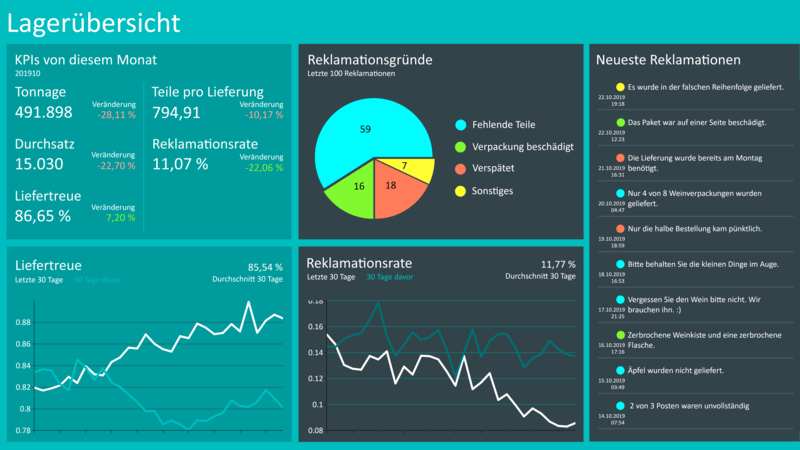
Save time with our templates
No time for long designs? No problem: Use one of the many ready-made templates for dashboards and applications — e.g. for production monitoring, warehouse management or quality assurance. Pick a template, customize it, and you're done.