Data connection with
Modbus
- Real-Time Modbus Visualization without additional SCADA software
- Custom dashboards & HMI directly in Peakboard Designer
- Flexible integration with SAP, OPC UA, SQL & other data sources
Peakboard as a powerful
Modbus TCP client
Peakboard is your full-fledged Modbus TCP client that allows you to easily connect devices with a Modbus interface — whether as a master or slave. In Peakboard Designer, you can read, filter, calculate and vividly visualize data with just a few clicks.
Direct connection via Modbus/TCP
Peakboard supports all important reading functions and allows you to flexibly define and structure variables. In addition, you can also write back data to directly control processes.
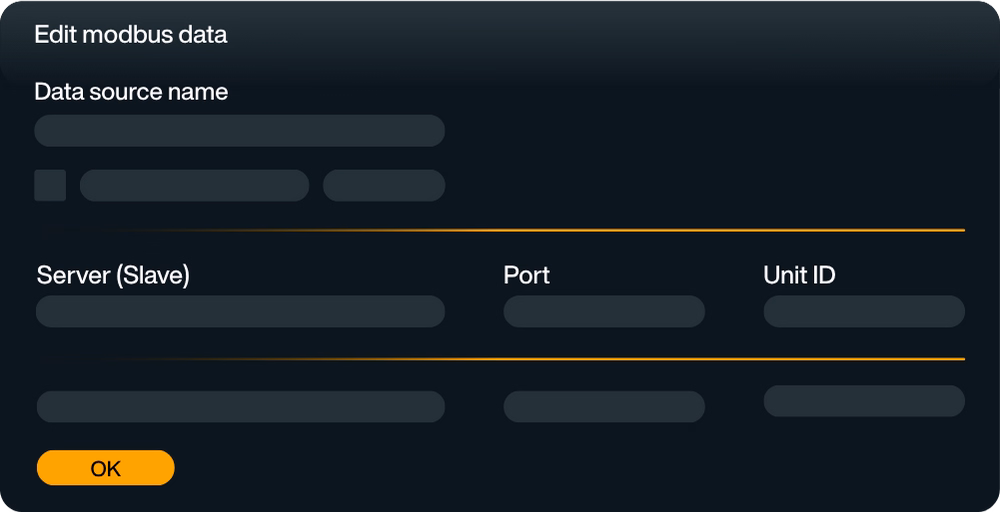
Read Modbus TCP data
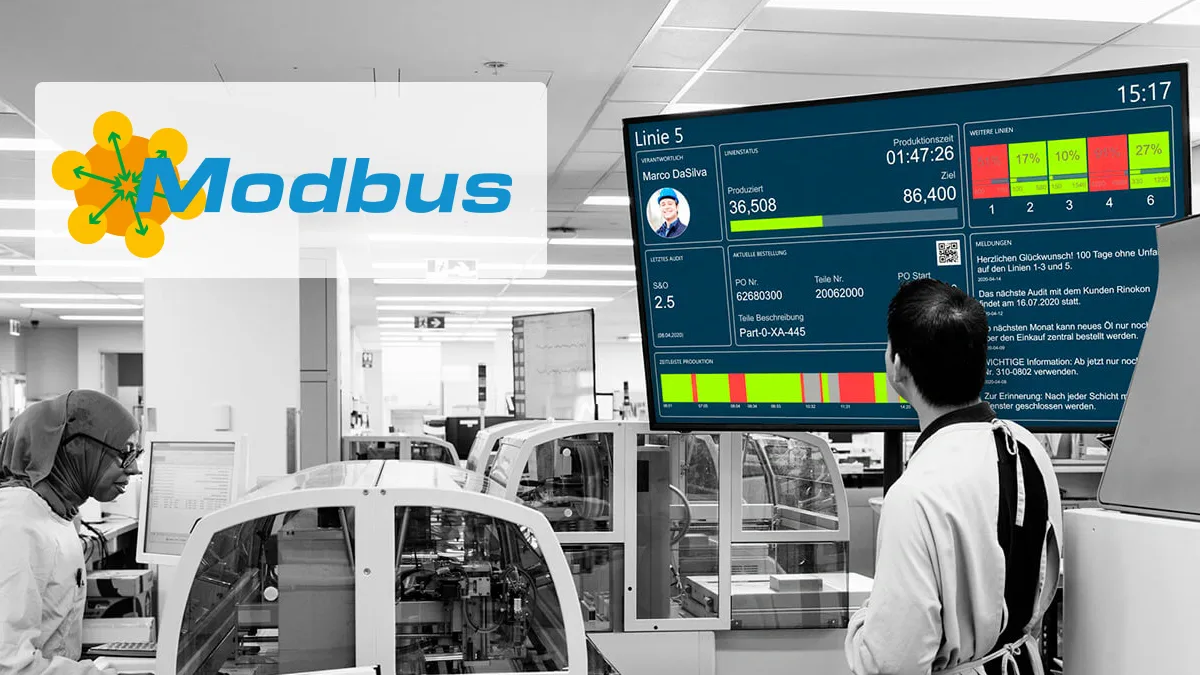
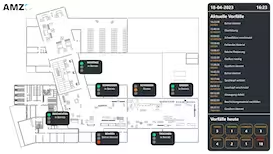
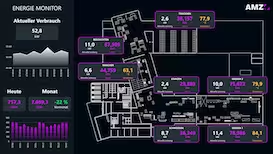
Instead of rigid displays, Peakboard offers you fully interactive dashboards that you can flexibly and precisely tailor to your production environment. Visualize measurements, machine states, or alarms in real time, e.g. with color coding, KPIs, charts, or tables.

Write back data
With interactive elements such as buttons, switchers, dropdowns, or touch elements, you can build applications with which your employees actively intervene in processes — directly on the HMI or dashboard. This gives you maximum transparency on the shop floor, in the control room or in maintenance.

No programming effort
With the integrated low-code logic, you can set individual rules and automate reactions in the event of faults — simply by dragging and dropping.

Combine data
Flexibly combine your Modbus data with other systems such as SAP, OPC UA or SQL databases — for a holistic data landscape that creates transparency and makes processes more efficient.

Quickly configured & ready for immediate use
Learn how to integrate Modbus communication into your Peakboard applications using scripting templates. This tutorial shows you how to connect to Modbus devices and read or write data for seamless integration with industrial hardware.
Save time with our templates
No time for long designs? No problem: Use one of the many ready-made templates for dashboards and applications — e.g. for production monitoring, warehouse management or quality assurance. Pick a template, customize it, and you're done.


Peakboard as a Modbus TCP client
Peakboard acts as a full-fledged Modbus TCP client and makes it easy to connect devices with a Modbus interface — whether as a master or slave. With just a few clicks in Peakboard Designer, data can be read, filtered, calculated and displayed graphically.
- Direct connection via Modbus/TCP
- Supports reading functions (read coils, read registers, etc.)
- Define and structure variables flexibly
- Also write back data (Write Functions)
Interactive dashboards in real time
Instead of rigid displays, Peakboard offers you fully interactive dashboards that you can flexibly and precisely tailor to your production environment. Visualize measurement values, machine states or alarms live — e.g. via color coding, KPIs, charts or tables. This gives you maximum transparency on the shop floor, in the control room or in maintenance.
But Peakboard goes beyond pure visualization: With interactive elements such as buttons, switchers, dropdowns or touch elements, you can build applications with which your employees actively intervene in processes — directly on the HMI or dashboard. For example, you can integrate an acknowledgement option for alerts or provide manual controls for specific machine states.
With the help of integrated low-code logic, you set individual rules — for example when limit values are exceeded or faults — and define automatic responses or escalations. In addition, data sources can be combined with each other to make dependencies visible, e.g. between temperature profile, energy consumption and flow rate.
Cleverly link Modbus data
Are your Modbus devices not the only source of data? Then simply combine them with other systems such as:
- SAP
- MES
- SQL
- OPC AND OTHERS
- IoT platforms (e.g. Azure, AWS)
This creates a holistic picture of your production data — from control to company vision.
Quick to set up, instantly productive
The configuration is carried out directly in Peakboard Designer — without complex programming. Communication via Modbus/TCP is robust, proven and ideal for industrial applications. And thanks to the edge architecture, no additional middleware or server structure is required.
Your benefits with Peakboard and Modbus at a glance
With Peakboard, you can visualize your Modbus data quickly, efficiently and without having to go through complex SCADA systems. The platform allows you not only to read data in real time, but also to calculate, process and write back when needed. You design individual dashboards and HMI interfaces that are tailored exactly to your use cases — clear, interactive and intuitive to use.
In addition, Peakboard can be flexibly linked to other systems such as SAP, OPC UA or SQL databases. This creates a holistic data landscape that creates transparency and makes processes more efficient. Thanks to the simple configuration and scalable architecture, Peakboard is ready for use within a very short time — whether in a pilot project or in series production.

Start now for free with Peakboard Designer
Capture, process and visualize production and order data in real time — simply and without programming knowledge.


All of your data.
Peakboard connects your systems and brings all data to one platform — for visualization, automation and individual applications.


%201.svg)


%201.svg)


More information
for your start with Peakboard.

Save time with our templates
No time for long designs? No problem: Use one of the many ready-made templates for dashboards and applications — e.g. for production monitoring, warehouse management or quality assurance. Pick a template, customize it, and you're done.