Shop floor analytics with Microsoft Power BI
Shopfloor data analysis is the key to operational excellence: Only those who know the current status of their production processes can intervene in good time and exploit optimization potential. With Peakboard and Microsoft Power BI, you combine real-time visualization on the shop floor with detailed analyses — without cumbersome IT projects.


More transparency and faster decisions
With Peakboard and Power BI, you can analyze your shop floor data more efficiently than ever. Transparent key figures enable faster decisions and open the way for long-term process optimization — without complicated IT projects.
Challenge
- Lack of transparency of shop floor data
- Delayed or incomplete information
- High effort for subsequent data analysis
Solution with Peakboard
- Central collection and storage of all shop floor data
- Intuitive visualization and flexible dashboards for Power BI
- Faster insights through automated data preparation
Result
- Comprehensive insight into historical shop floor data
- Well-founded decisions based on meaningful analyses
- Responding flexibly to process changes and new requirements
Fully adaptable to your needs
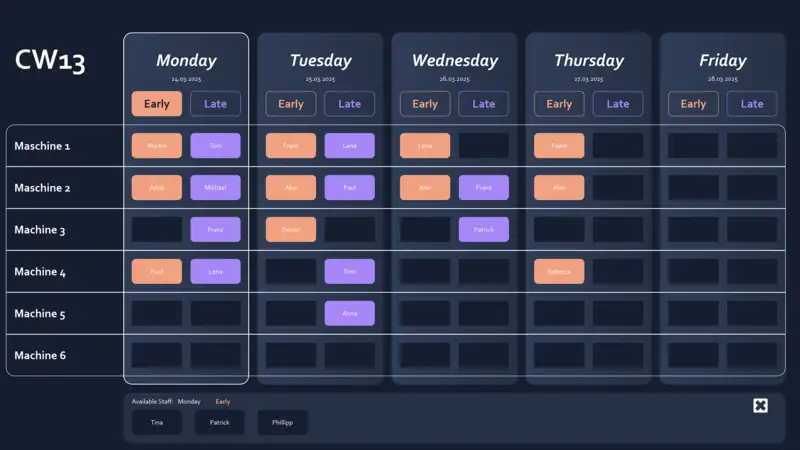
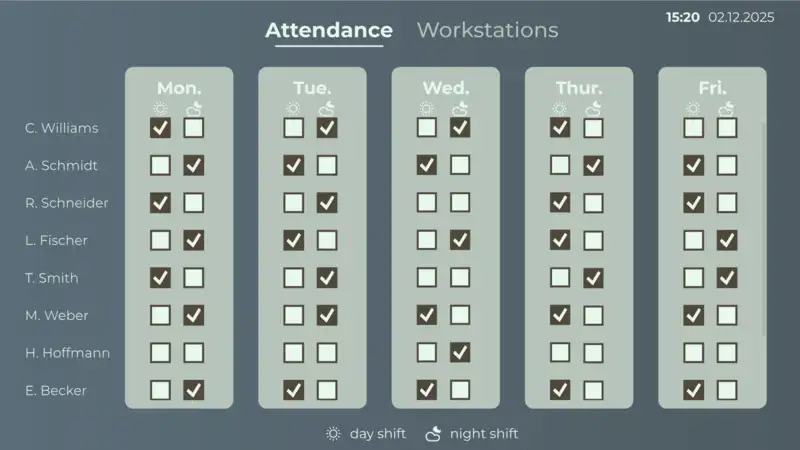
Shop Floor Management
As flexible as your processes.
With Peakboard, you create a centralized and flexible solution for your daily shop floor communication – perfectly tailored to your individual workflows.

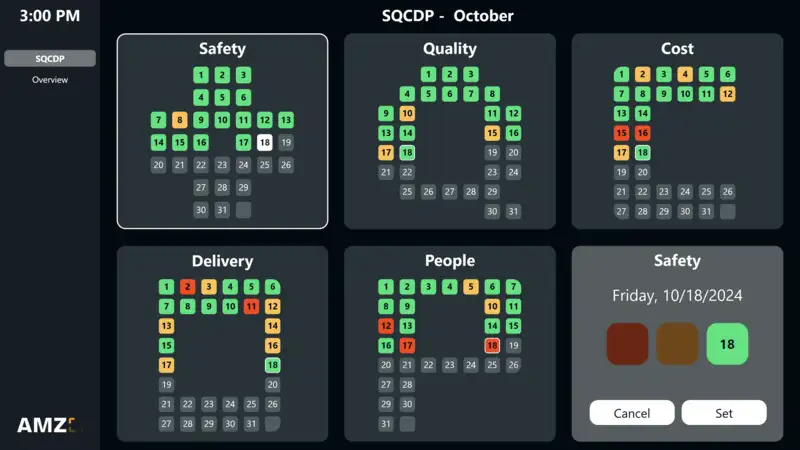
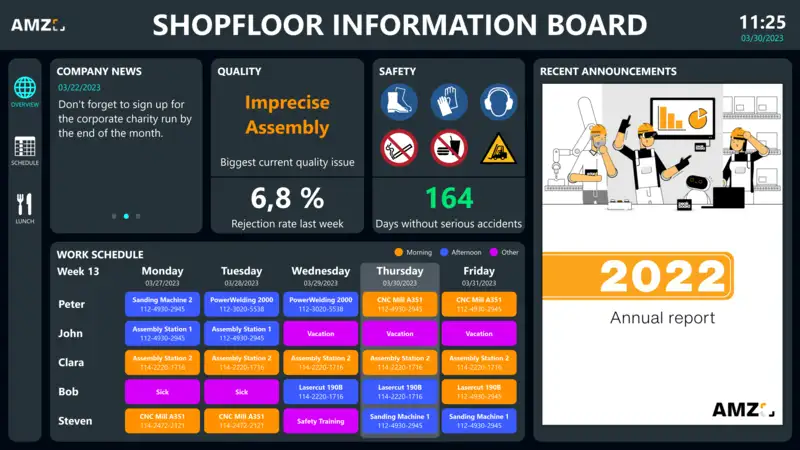
- Standardised SQDC reports for a quick overview of the regular meeting
- Define your own key figures – manually or automatically
- Capture, edit, and track measures — structured and team-oriented
- Assign responsibilities with notifications via email, MS Teams, or Slack
- Adjust menu structure and content to fit your department’s needs
- Store historical data and analyze it with Power BI, QlikView, or Tableau
Discover how flexible shop floor management can be with Peakboard


All of your data.
One platform.
Peakboard connects your systems and brings all data to one platform — for visualization, automation and individual applications.


%201.svg)


%201.svg)


How to bring transparency and speed to your processes in 30 days
Implementing new software shouldn't take a year.
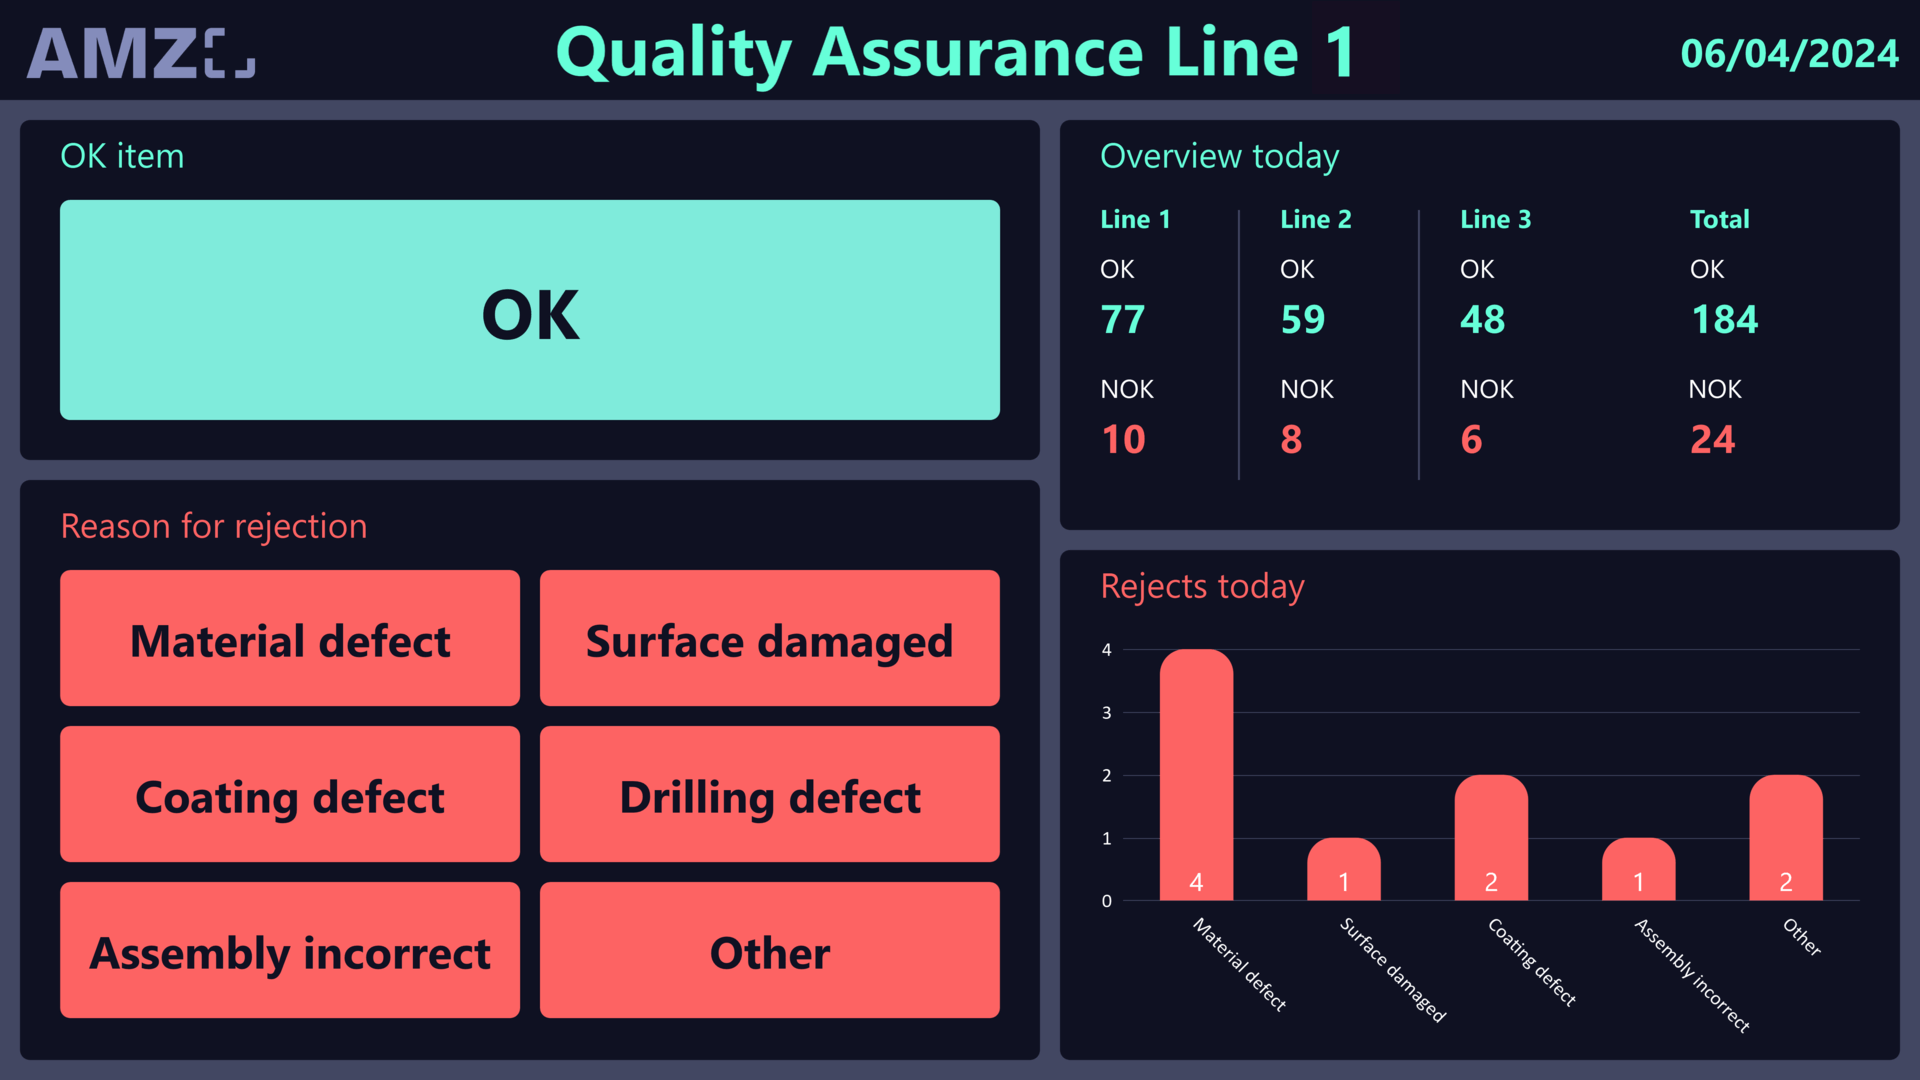
Get started for free with Peakboard Designer
Create your shop floor analytics dashboard to visualize your production data with Power BI and gain deep insights. Combine the power of Peakboard and Power BI to monitor all important KPIs in real time and make well-founded decisions — without much IT effort


Operational excellence means continuously improving production processes and reducing waste. To achieve this, shop floor transparency and well-founded data are essential. This is exactly where the integration of Peakboard and Microsoft Power BI comes into play, which enables companies to access all relevant data in real time and analyze it in depth. The result is continuous optimization of production processes and a clear increase in efficiency.
The combination of Peakboard and Microsoft Power BI offers numerous advantages for production:
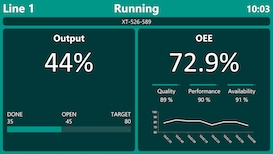
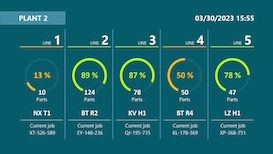
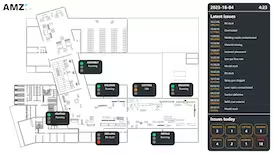
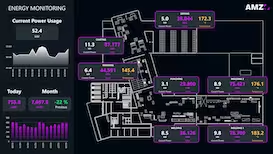
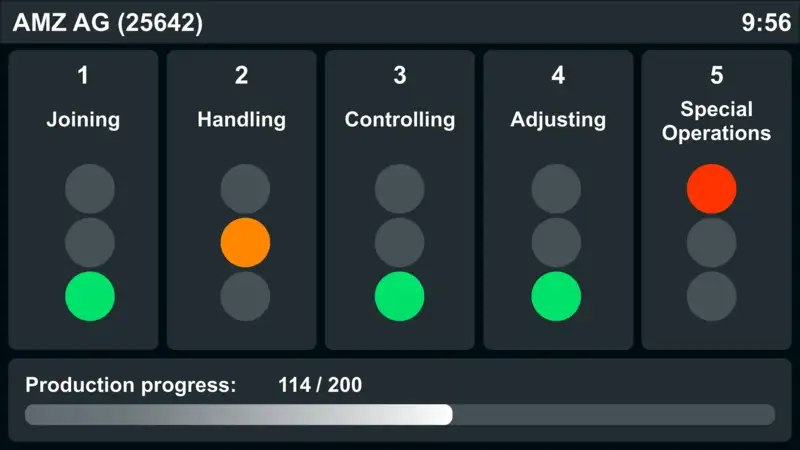
- Full control in real time: Dashboards on monitors or tablets provide immediate insight into all relevant shop floor processes.
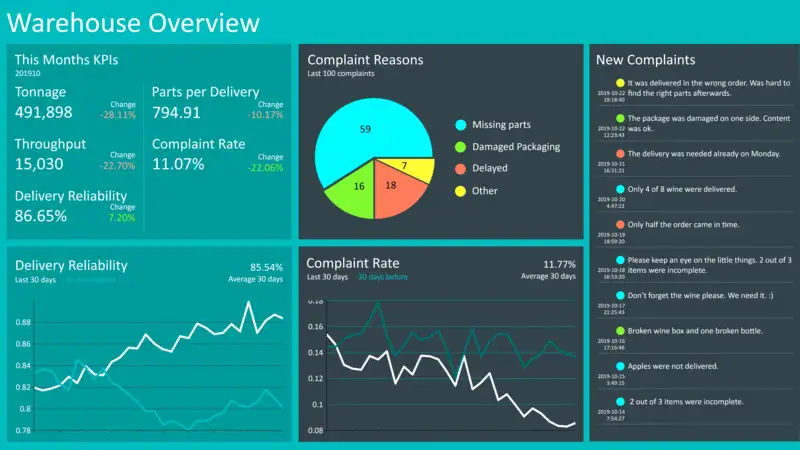
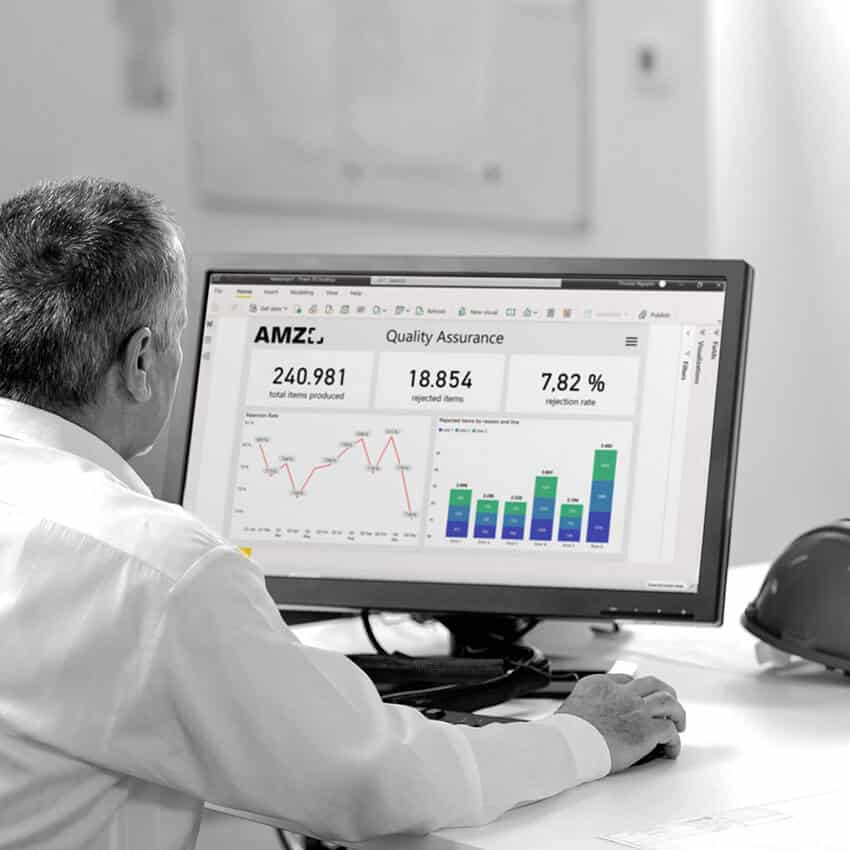
- In-depth analyses & reports: Power BI provides detailed insights into production quality, delivery times, and cost drivers, ideal for well-founded management decisions.
- Scalability & adaptability: Regardless of whether a single production line is to be monitored or several plants worldwide are to be compared — the solution grows with the company's requirements.
- Quick implementation: With a Peakboard Box and Peakboard Hub, machines, sensors or manual data inputs can be quickly integrated, which enables rapid implementation.
- Flexible data access: Power BI enables self-service analyses directly in specialist departments, without complex IT processes.
- Real-time and long-term perspective: While employees see real-time data on the shop floor, Power BI can also analyze long-term trends. This provides a complete picture of the current situation and future potential.
- Increased motivation & personal responsibility: Transparent performance indicators strengthen teams' commitment and enable rapid action in the event of deviations.
Peakboard and Microsoft Power BI enable seamless integration and analysis of production data in four easy steps:
- Data connection: Connect all relevant production and machine data (e.g. from Siemens S7 or MQTT) to the Peakboard Box. Manual BDE inputs can be added as an option to complete data collection.
- Data preparation & storage: Visualize important KPIs directly on the shop floor and store raw data in the Peakboard Hub, which acts as a central database.
- Further processing in Power BI: Analyze the collected data, such as error rates, processing times, or energy consumption, in Microsoft Power BI. Create custom reports and share them across your organization.
- Continuous improvement: Use the insights from the analyses to eliminate bottlenecks and optimize maintenance intervals. Thanks to flexible dashboards in Peakboard, all parties involved can react in real time, which significantly speeds up the continuous improvement process (KVP).
Peakboard offers a powerful and user-friendly solution for data connection and preparation that helps companies optimize their production processes:
- Easy and fast data connection: Peakboard provides an easy connection to various data sources such as machines, sensors and ERP systems (e.g. Siemens S7, MQTT, SAP, Microsoft Dynamics). This ensures that all relevant production data can be captured and visualized in real time, without complex IT integrations or expensive infrastructure setups.
- Seamless data preparation: Data from various sources is centralized and processed to prepare it for analysis and visualization. With Peakboard, companies can translate their data into understandable KPIs and dashboards — without any in-depth programming knowledge. In this way, data is made available to all parties involved.
- Centralized and secure data storage: All collected data is securely stored in the Peakboard Hub. The central database enables quick and easy further processing of data in business intelligence tools such as Power BI or Tableau. This ensures that data is always available and easily accessible — and at the same time protects the solution against data loss or inconsistencies.
- Scalability and flexibility: Peakboard can be flexibly adapted to the growing requirements of a company. Regardless of whether it is a small production line or a complex production environment with several locations — Peakboard grows with you and offers a scalable solution for companies of all sizes.
- Real time data processing: By using MQTT as an IoT interface, data is transmitted in real time and immediately visualized. This makes it possible to react immediately to bottlenecks or deviations and enables proactive control of production processes.
Used by industry experts
to cleverly simplify processes.

“In the past, it was not only impossible to see the status of all machines at a glance, but it was also cumbersome to make adjustments to the displays. Today, information from multiple systems can be linked together and displayed on a single dashboard. This can be adjusted by us independently and easily, which significantly increases flexibility. ”
Save time with our templates
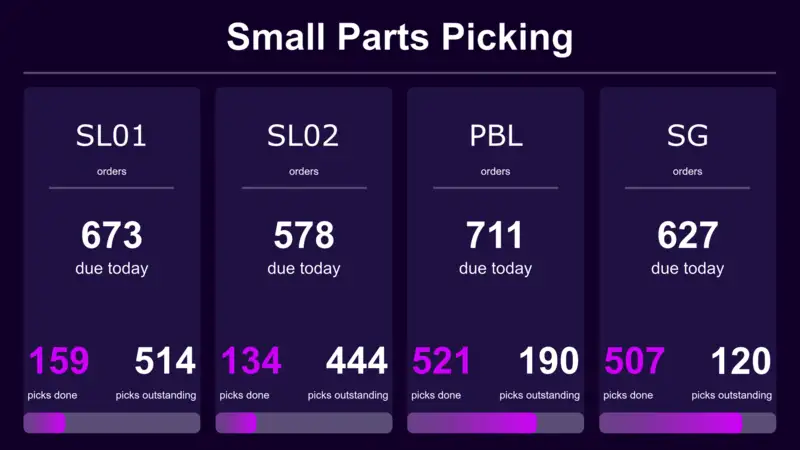
No time for long designs? No problem: Use one of the many ready-made templates for dashboards and applications — e.g. for production monitoring, warehouse management or quality assurance. Pick a template, customize it, and you're done.