Data connection with
MQTT
- Direct MQTT connection: Connect your MQTT broker without additional software and visualize topics live on dashboards or touch displays.
- Full flexibility: Supports all common topic formats (Standard, Advanced, Dynamic) as well as publish/subscribe functionality.
- IoT-ready: Perfect for projects with Raspberry Pi, sensors and industrial apps — scalable from edge to shop floor.
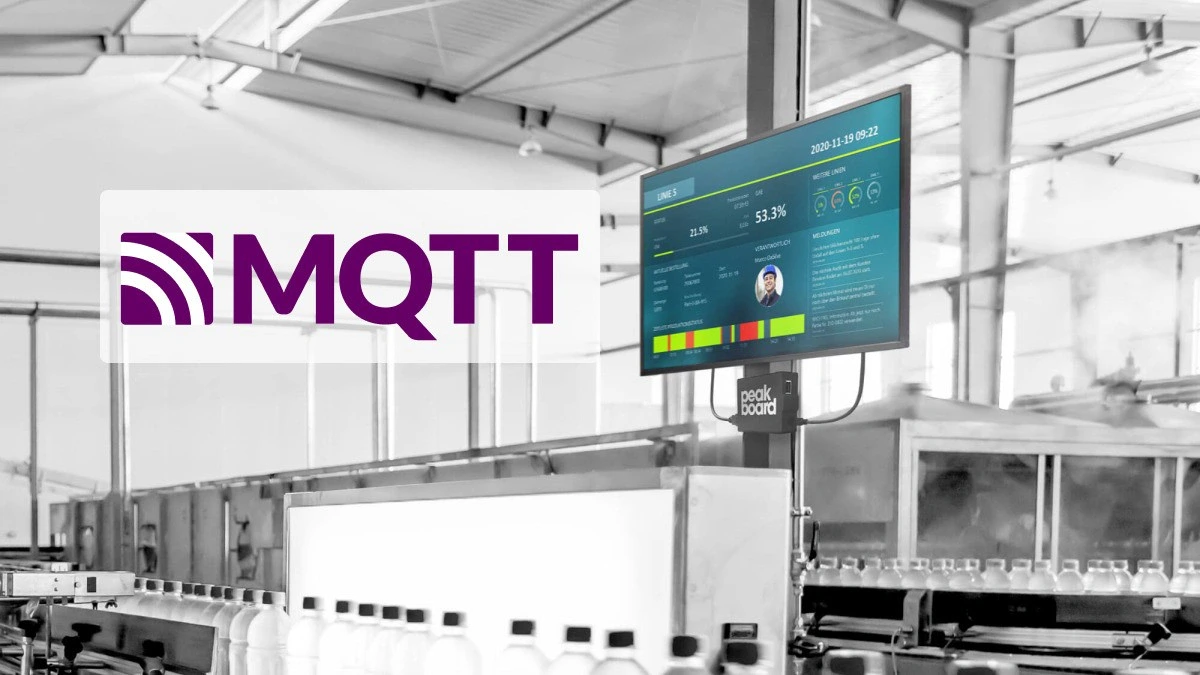
Peakboard as a powerful
MQTT client.
Receive, process and visualize data in real time — directly from the MQTT broker to your dashboard. With Peakboard, you get your MQTT data to where it's really needed: on clear dashboards right at the point of action. Whether it's an IoT device, machine or sensor — Peakboard visualizes your operational data quickly, flexibly and without code.
Direct MQTT communication without middleware
Peakboard connects directly to your MQTT broker — without additional software or middleware. MQTT (Publish & Subscribe) data ends up where it is needed in real time: on your dashboard, on the machine, or in the IoT device.
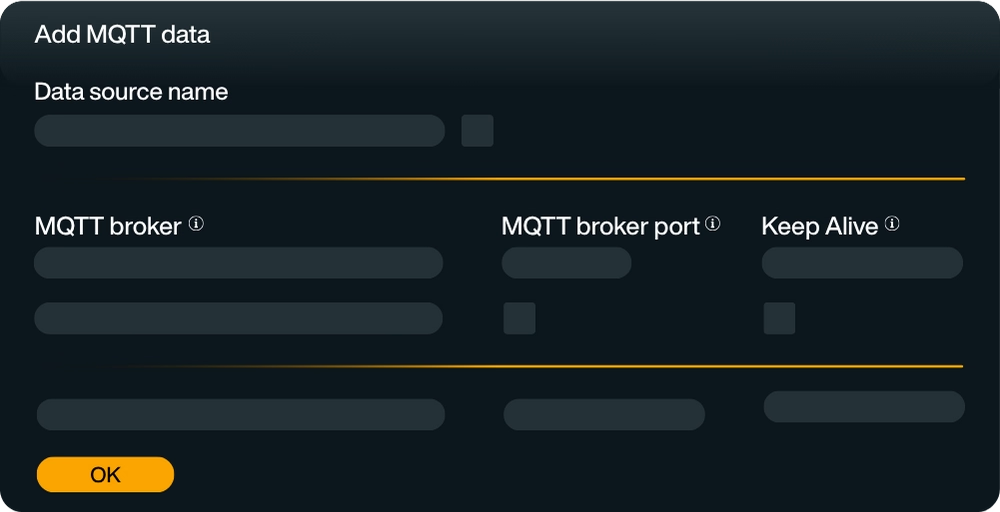
Flexible MQTT data integration & preparation
Process MQTT (Standard, Advanced, Dynamic) topics as needed and combine them with ERP, MES, or SQL data. This creates a networked view of IoT data, machine states and system indicators.

Ideal solution for IoT projects
Whether it's Raspberry Pi, sensors, or edge devices — Peakboard scales with you. IoT data streams via MQTT can be reliably visualized, analyzed and integrated into production or logistics processes.

No programming effort
With Peakboard Designer, you can easily create interactive dashboards for MQTT data — without any programming knowledge. Use visual elements and low-code logic to present your MQTT topics quickly and easily.

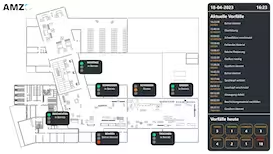
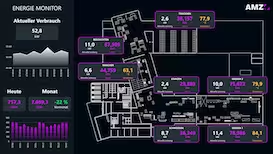
Individual visualization of MQTT data
Color indicators, charts, live KPIs, or process visualizations. This clearly visualizes your MQTT topics and translates them into usable data.

Quickly configured & ready for immediate use
In this video, we explain to you what MQTT is and how you can use it in your Peakboard applications. We'll show you step by step how to integrate MQTT data into Peakboard — from setting up your MQTT data source to sending and receiving data.

Save time with our MQTT templates
No time for long designs? No problem: Use one of the many ready-made templates for dashboards and interactive applications — e.g. to monitor your production in real time. Pick a template, customize it, and you're done.


Easily visualize MQTT data
Receive, process and visualize data in real time — directly from the MQTT broker to your dashboard. With Peakboard, you get your MQTT data to where it's really needed: on clear dashboards right at the point of action. Whether it's an IoT device, machine or sensor — Peakboard visualizes your operational data quickly, flexibly and without coding.
Peakboard is a full-fledged Cliente MQTT and supports both Subscribe As well as that Return (Publish) of data. With the MQTT broker, you receive messages from various topics, filter them as needed and visualize them live — without any additional software or middleware.
- Direct connection to the MQTT broker
- Flexible topic processing (standard, advanced, dynamic)
- Visualize critical information in real time
- Display on edge displays, dashboards, or HMIs
Individual dashboards for every application
With Peakboard Designer, you create interactive visualizations — from simple KPI ads to complex industrial apps. Color codes, diagrams, tables and signal elements ensure that your data is immediately understandable — such as temperature values, switching states or process indicators.
Features that bring your data to life
- Conditional formatting and automatic alerts
- Intelligent processing using low-code logic or Lua scripts
- Combination with data from ERP, MES, or SQL systems
- Ideal for IoT projects with Raspberry Pi, sensors, or edge devices
Ideal for industrial IoT applications
Whether you are already working with MQTT devices such as a Raspberry Pi or are looking for a stable, production-ready solution — with Peakboard, you can visualize your MQTT data more reliably and professionally. The Peakboard Box replaces classic craft solutions and offers you full scalability for real industrial requirements.
Start now for free with Peakboard Designer
Capture, process and visualize production and order data in real time — simply and without programming knowledge.


All of your data.
Peakboard connects your systems and brings all data to one platform — for visualization, automation and individual applications.


%201.svg)


%201.svg)


More information
for your start with Peakboard.

Save time with our templates
No time for long designs? No problem: Use one of the many ready-made templates for dashboards and applications — e.g. for production monitoring, warehouse management or quality assurance. Pick a template, customize it, and you're done.