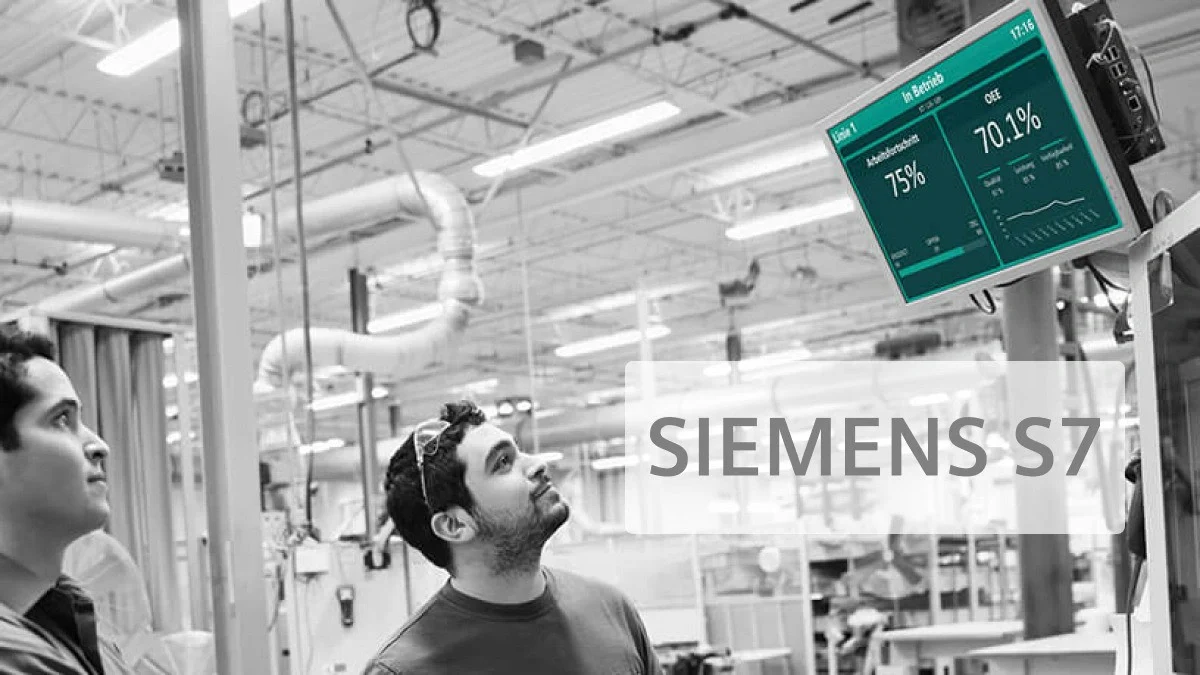
Data connection with
Siemens S7
- Direct S7 connection: Connect to Siemens PLC without detours using the RFC1006 protocol
- Visualization in real time: Display relevant control data immediately on the HMI
- Flexibly expandable: Can be combined with data from SAP, OPC UA, MQTT and more


Integrated Siemens S7 interface
With Peakboard, you can visualize data from Siemens S7 controllers (e.g. SIMATIC S7-300, S7-1200 or S7-1500) directly on a dashboard — without a TIA portal, engineering know-how or additional software. Your PLC data is recorded live, evaluated and visualized together with other sources such as SAP, OPC UA or MQTT. Peakboard supports the S7 protocol (RFC1006) and enables direct communication with your PLC. You can not only read process data, but also write it back if necessary — e.g. for confirmations or manual control commands.
- Direct connection to Siemens S7 control systems
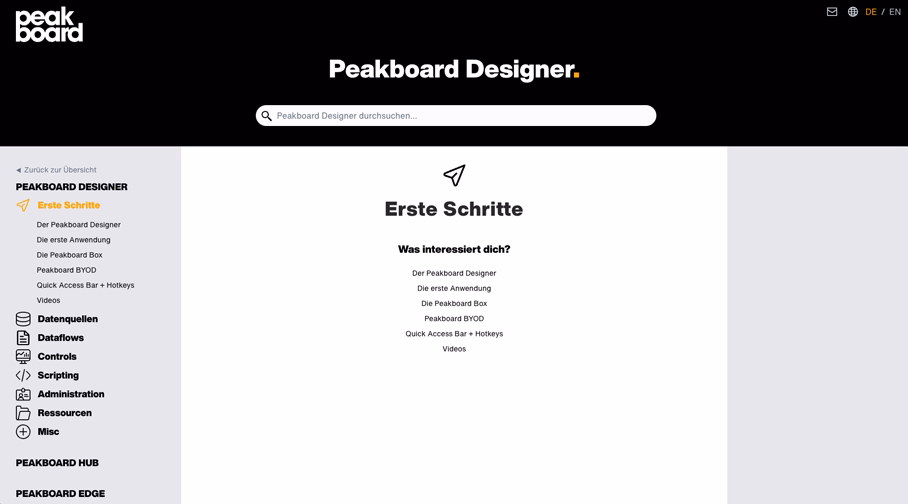
- Easy configuration via Peakboard Designer
- Real-time communication without middleware
- Access to data blocks, variables & byte offsets
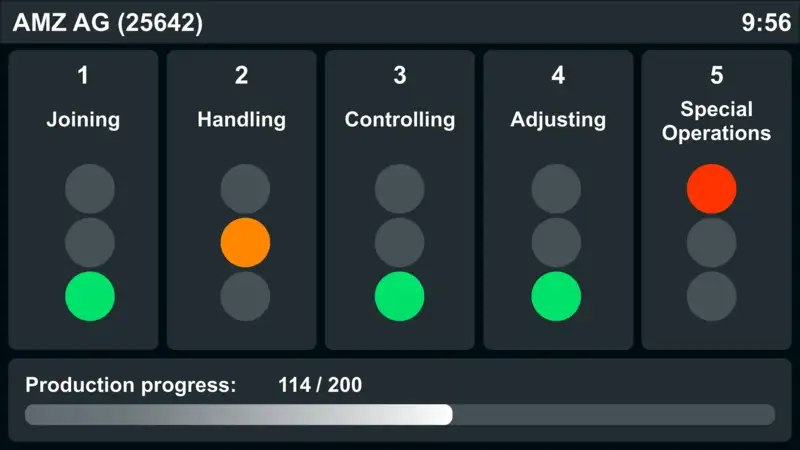
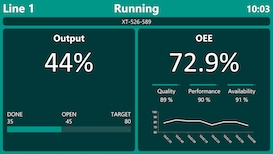
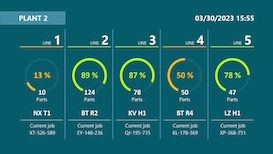
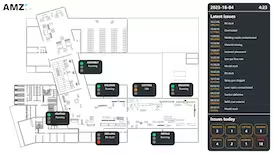
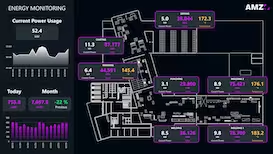
Visually display PLC data — for maximum transparency
Whether it's a fault display, meter reading, operating status or HMI elements: With Peakboard, you can visualize relevant control data on modern dashboards — visually, comprehensibly and in real time. Use conditional formatting, color codes, and automatic alerts for immediate response on the shop floor.
Combine & expand — beyond the PLC
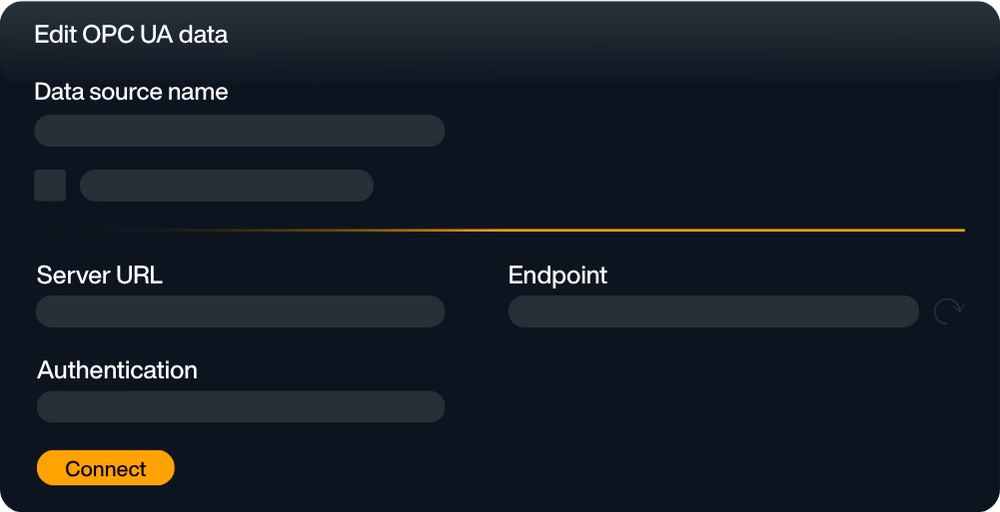
Peakboard is more than classic PLC visualization software. Link your Siemens data to other systems, such as:
- ERP (e.g. SAP)
- MES
- OPC UA server
- IoT platforms (Azure, AWS, Google Cloud)
This gives you a holistic view of your manufacturing processes — from control to management.
Why Peakboard is the smart solution for your PLC visualization
With Peakboard, you benefit from a particularly intuitive PLC visualization — without complex programming. Thanks to seamless integration into existing automation technology, the solution can be easily integrated into existing Siemens S7 controllers and industrial networks. It can be set up in no time, and thanks to the flexible expandability, you can adapt your system to new requirements at any time. The visualization takes place directly at the scene — via modern HMI displays, which provide your employees with exactly the information they need.
Start now for free with Peakboard Designer
Capture, process and visualize production and order data in real time — simply and without programming knowledge.


All of your data.
Peakboard connects your systems and brings all data to one platform — for visualization, automation and individual applications.


%201.svg)


%201.svg)


More information
for your start with Peakboard.

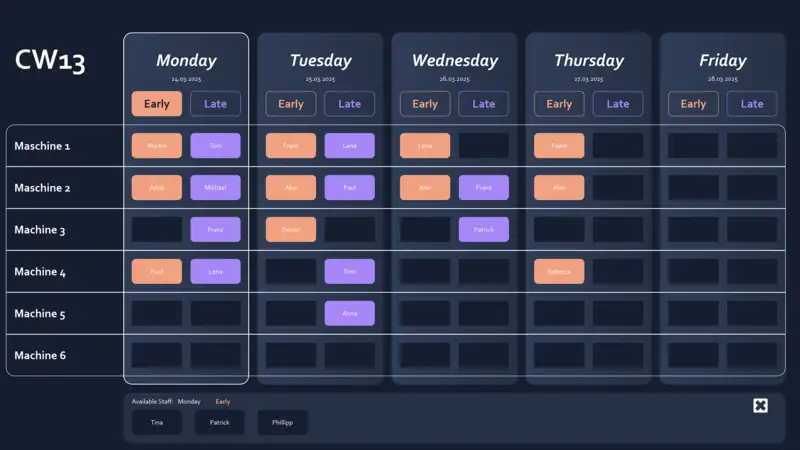
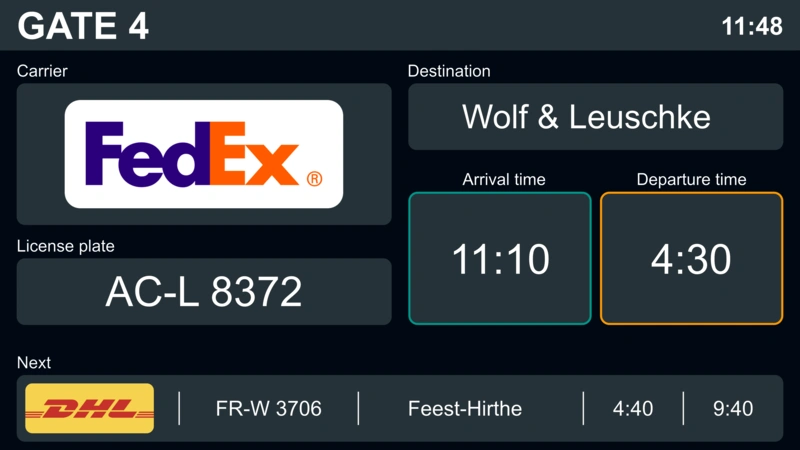
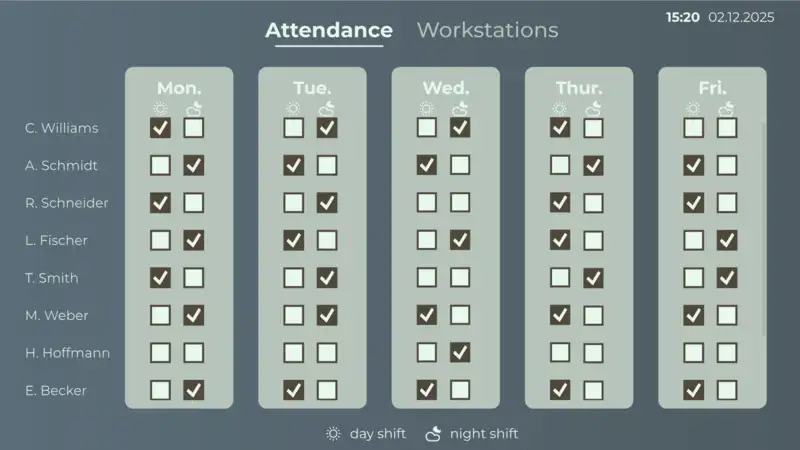
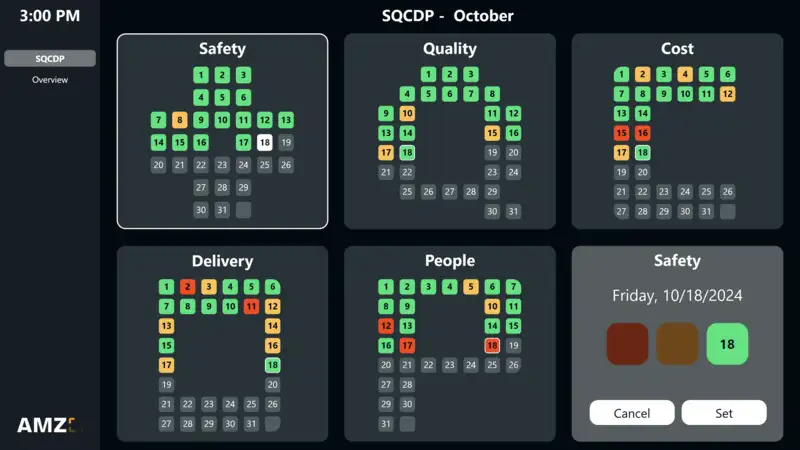
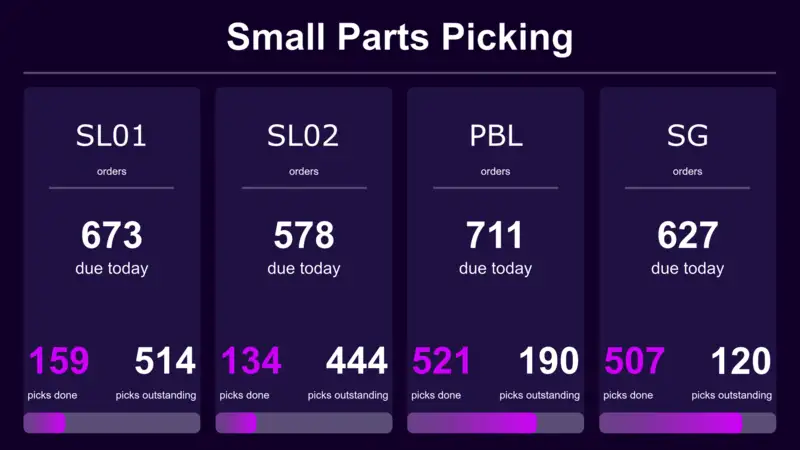
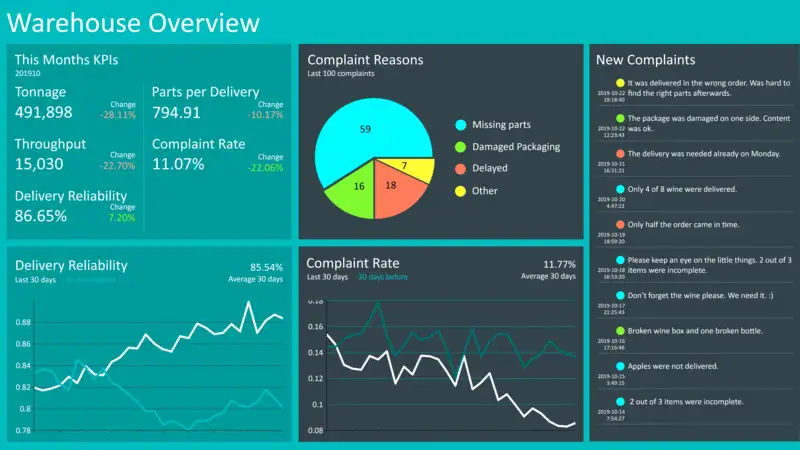
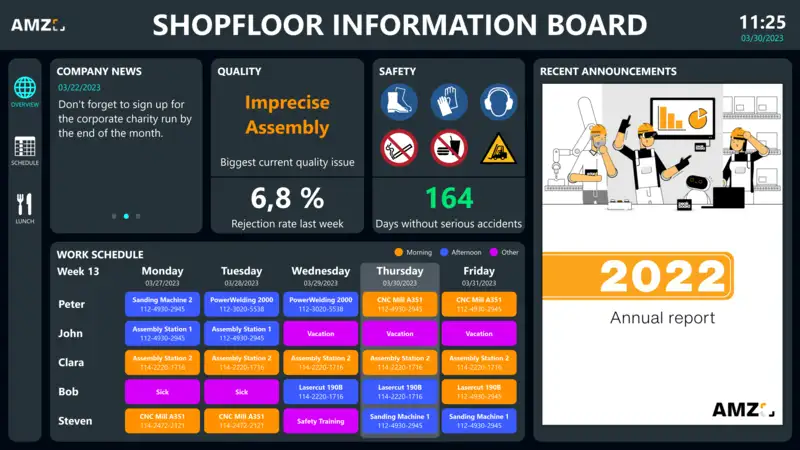
Save time with our templates
No time for long designs? No problem: Use one of the many ready-made templates for dashboards and applications — e.g. for production monitoring, warehouse management or quality assurance. Pick a template, customize it, and you're done.