
From factory to smart factory – in no time
Optimize your processes with Peakboard's real-time data visualization solutions – seamlessly integrable into existing processes.


What Peakboard can do


Peakboard simply explained
Made for results.

Everything you need to easily implement digitalization
The traditional way
- Complex setup that takes months and ties up significant IT resources.
- Limited integration of ERP systems, machines, and sensors.
- High, ongoing costs for licenses, implementation, and maintenance.
Do it better with Peakboard
- Create your custom applications in hours – without an IT department.
- Connect your data and systems seamlessly and easily integrate Peakboard into your infrastructure.
- Lower your costs with Peakboard: Everything included — hardware, updates and support.
Flexible and scalable – designed for your requirements.
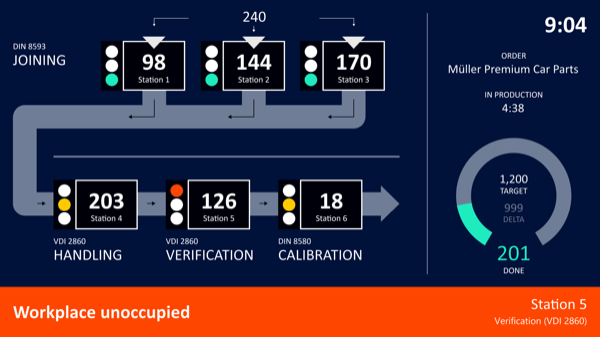
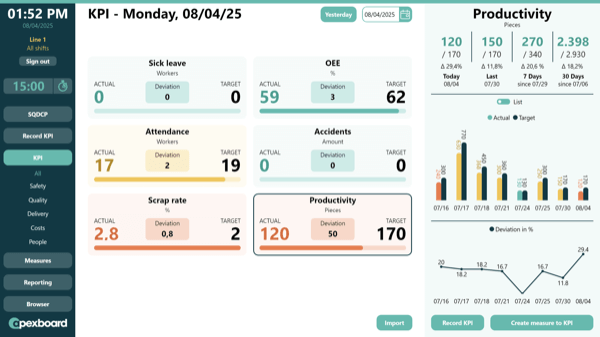
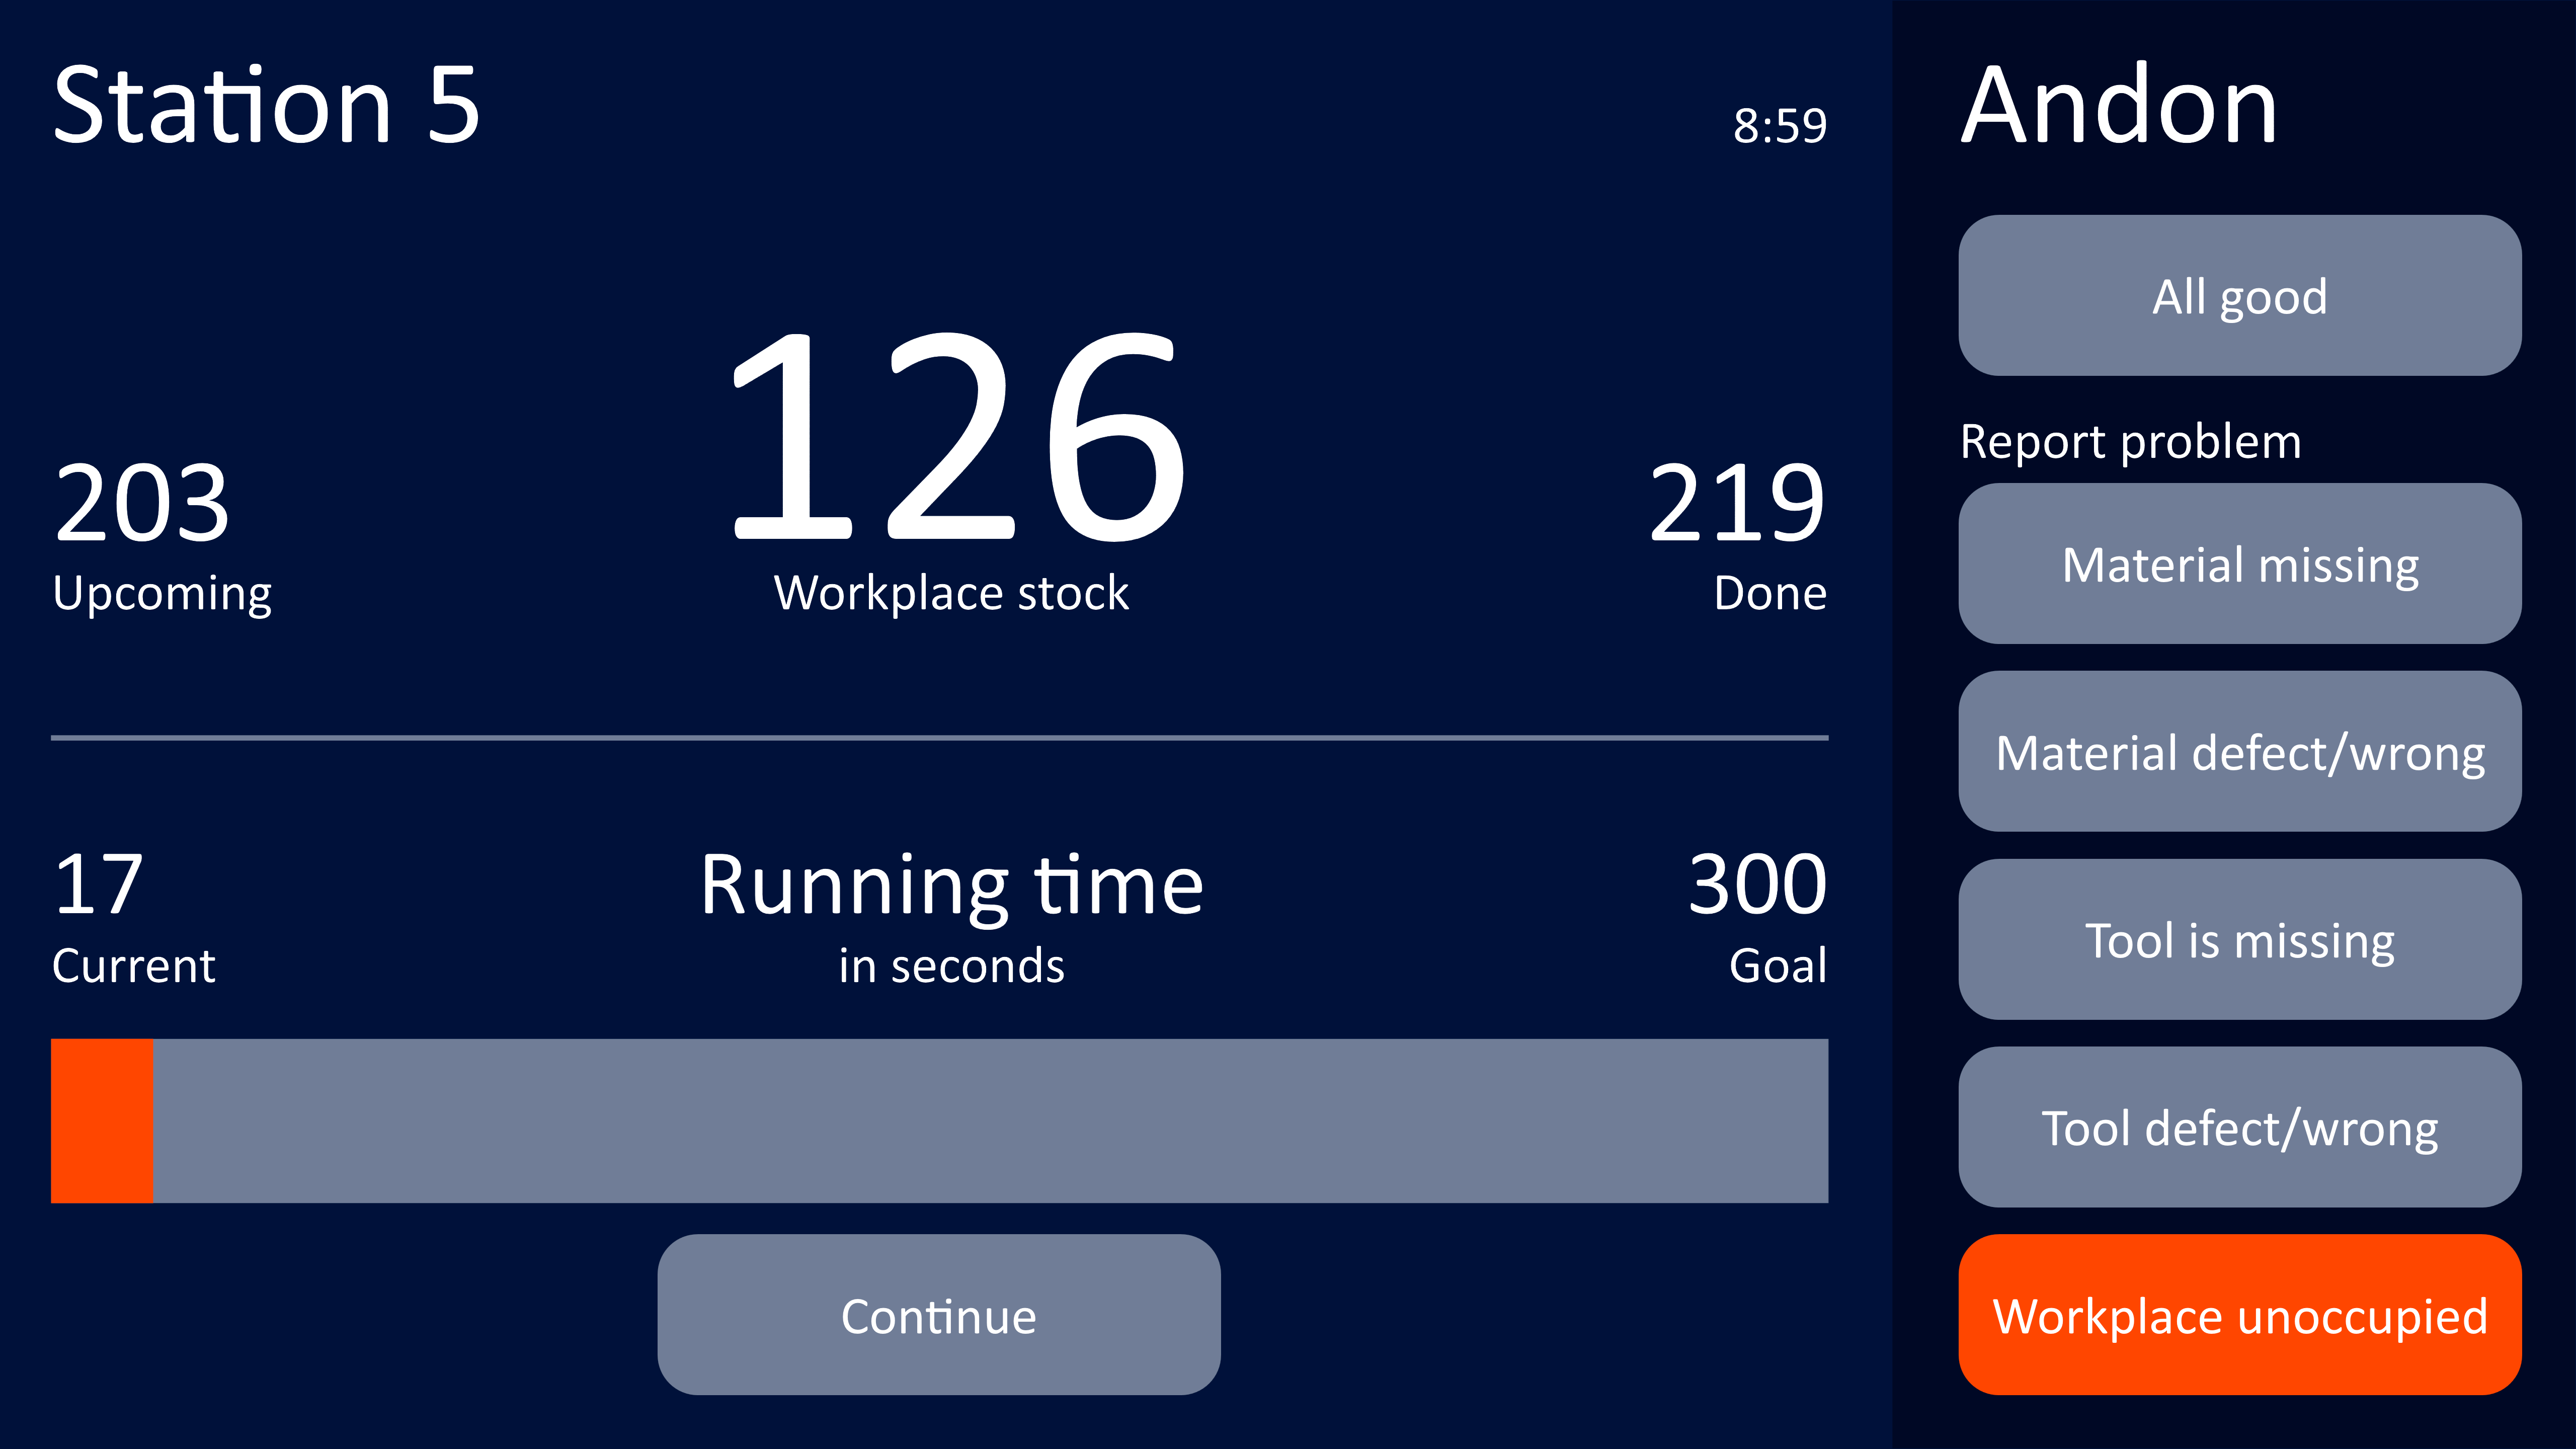
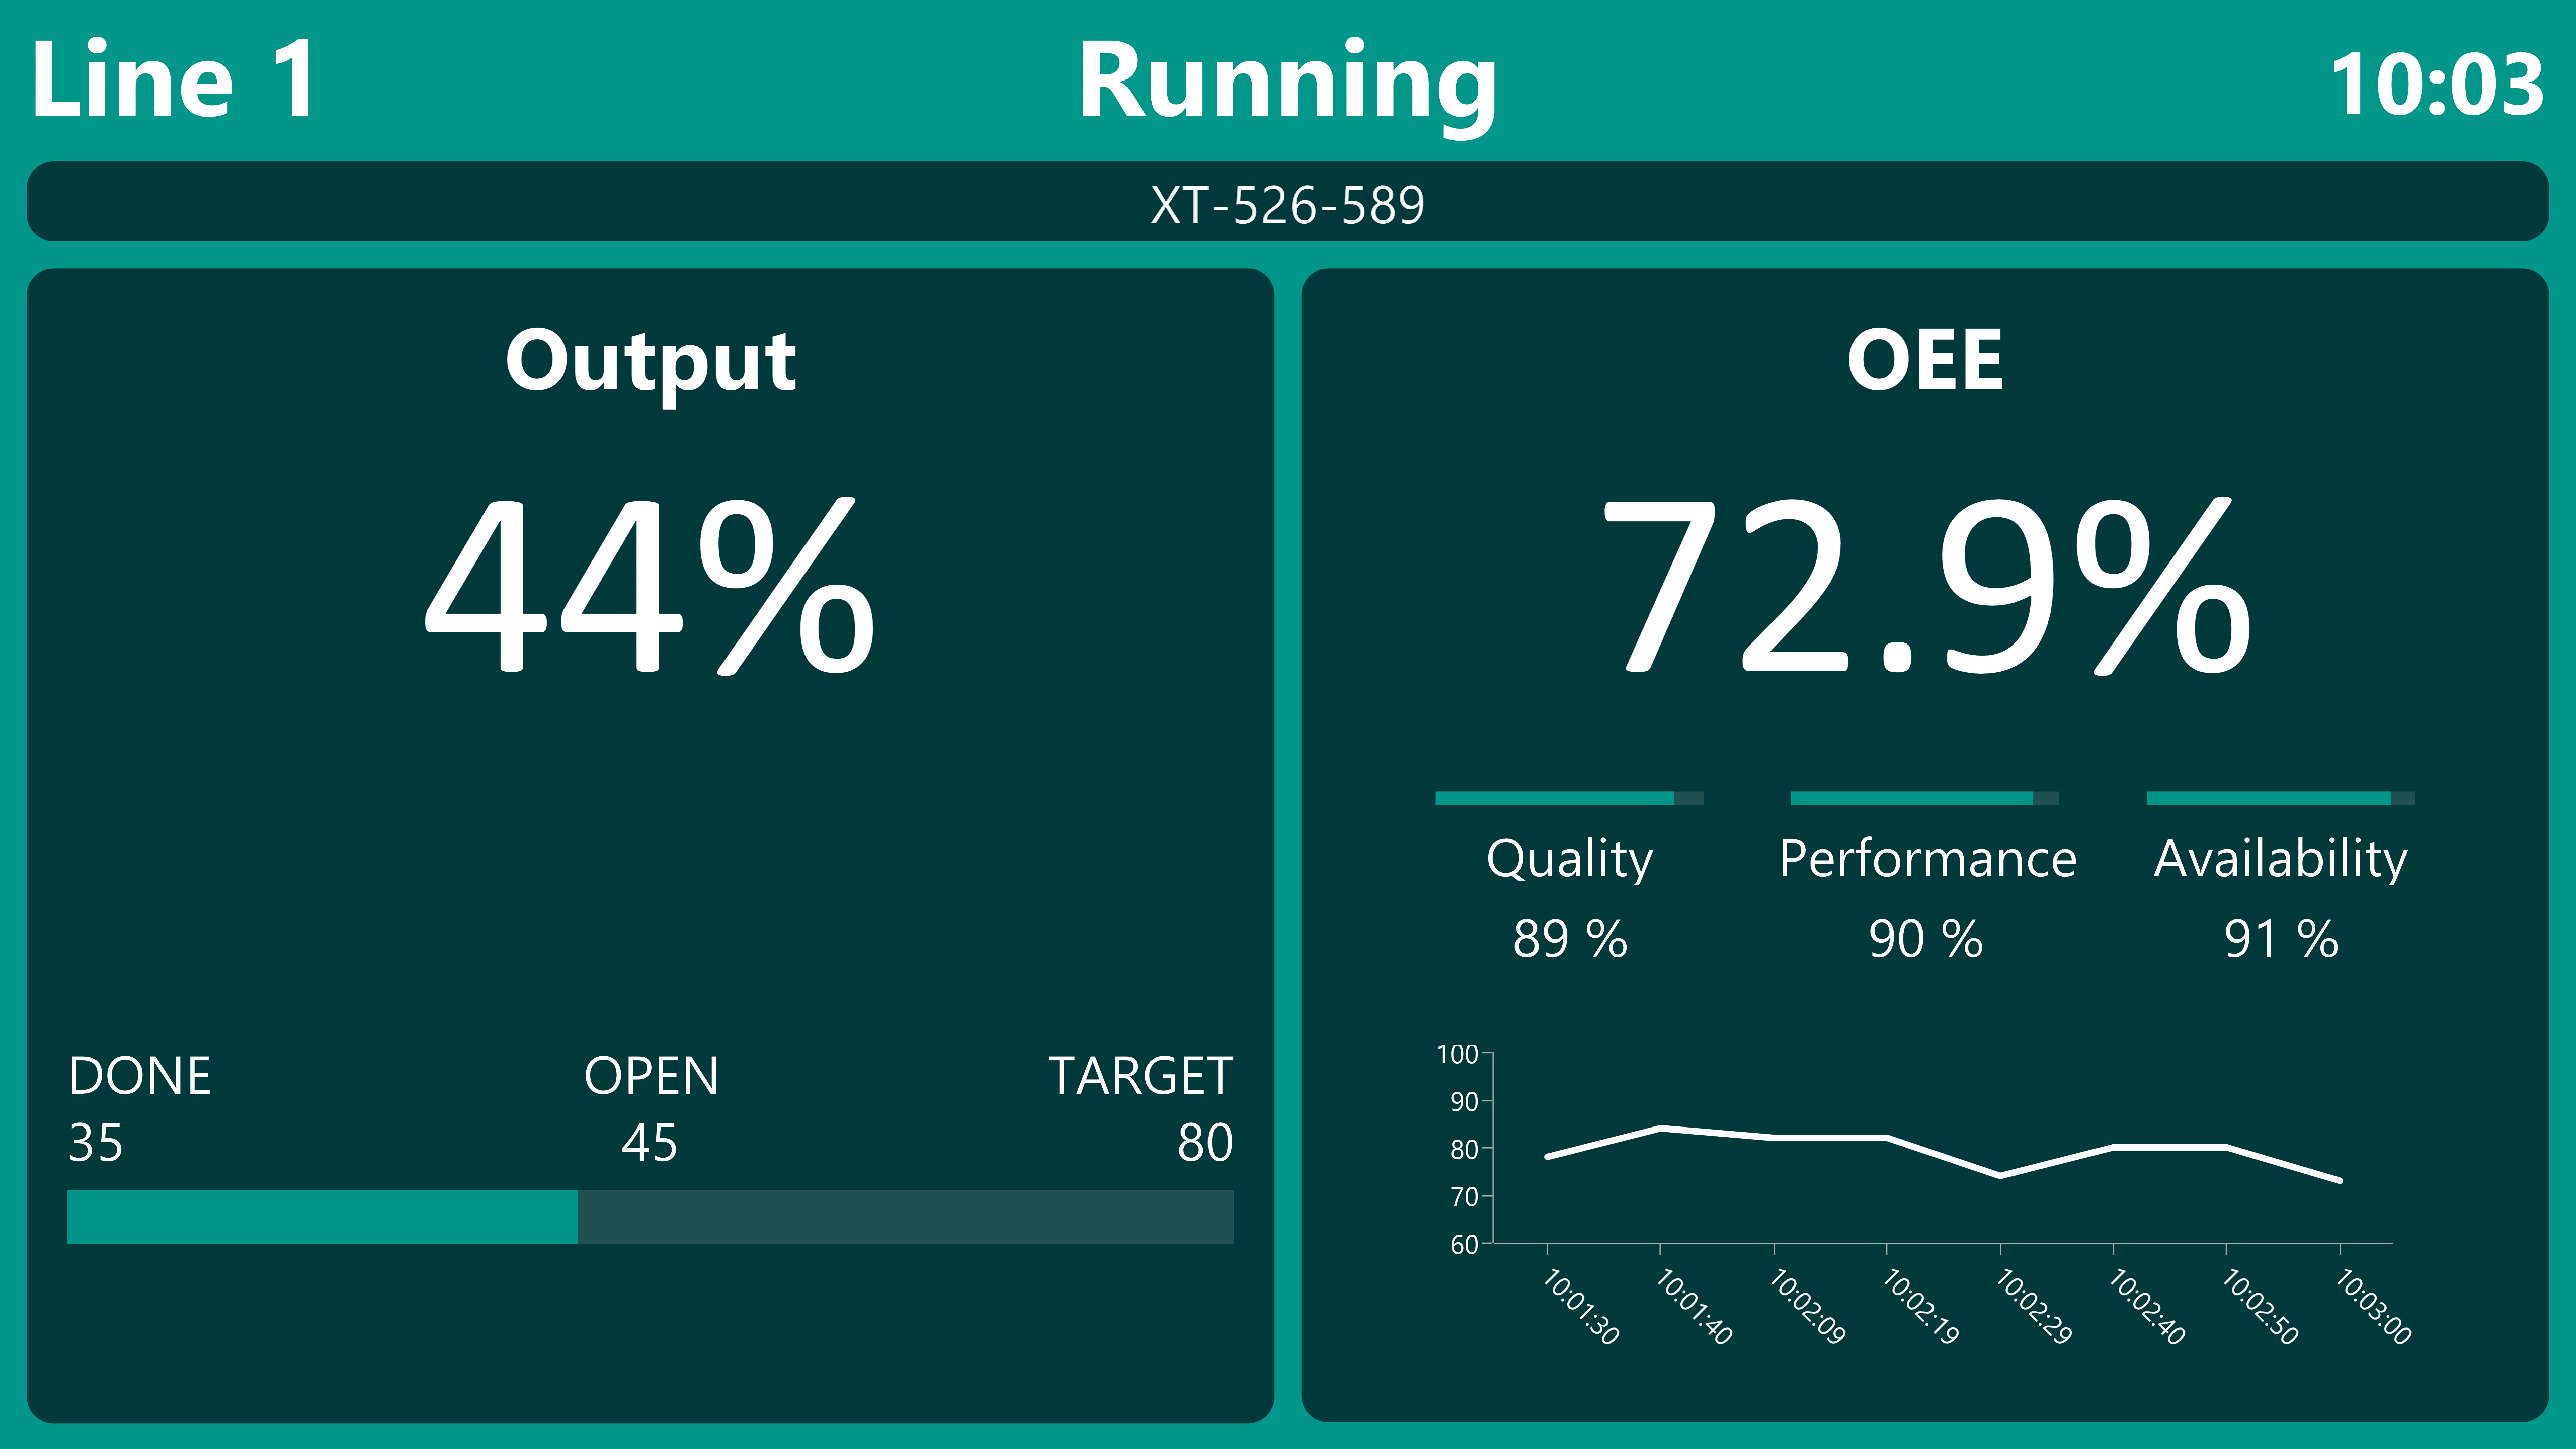
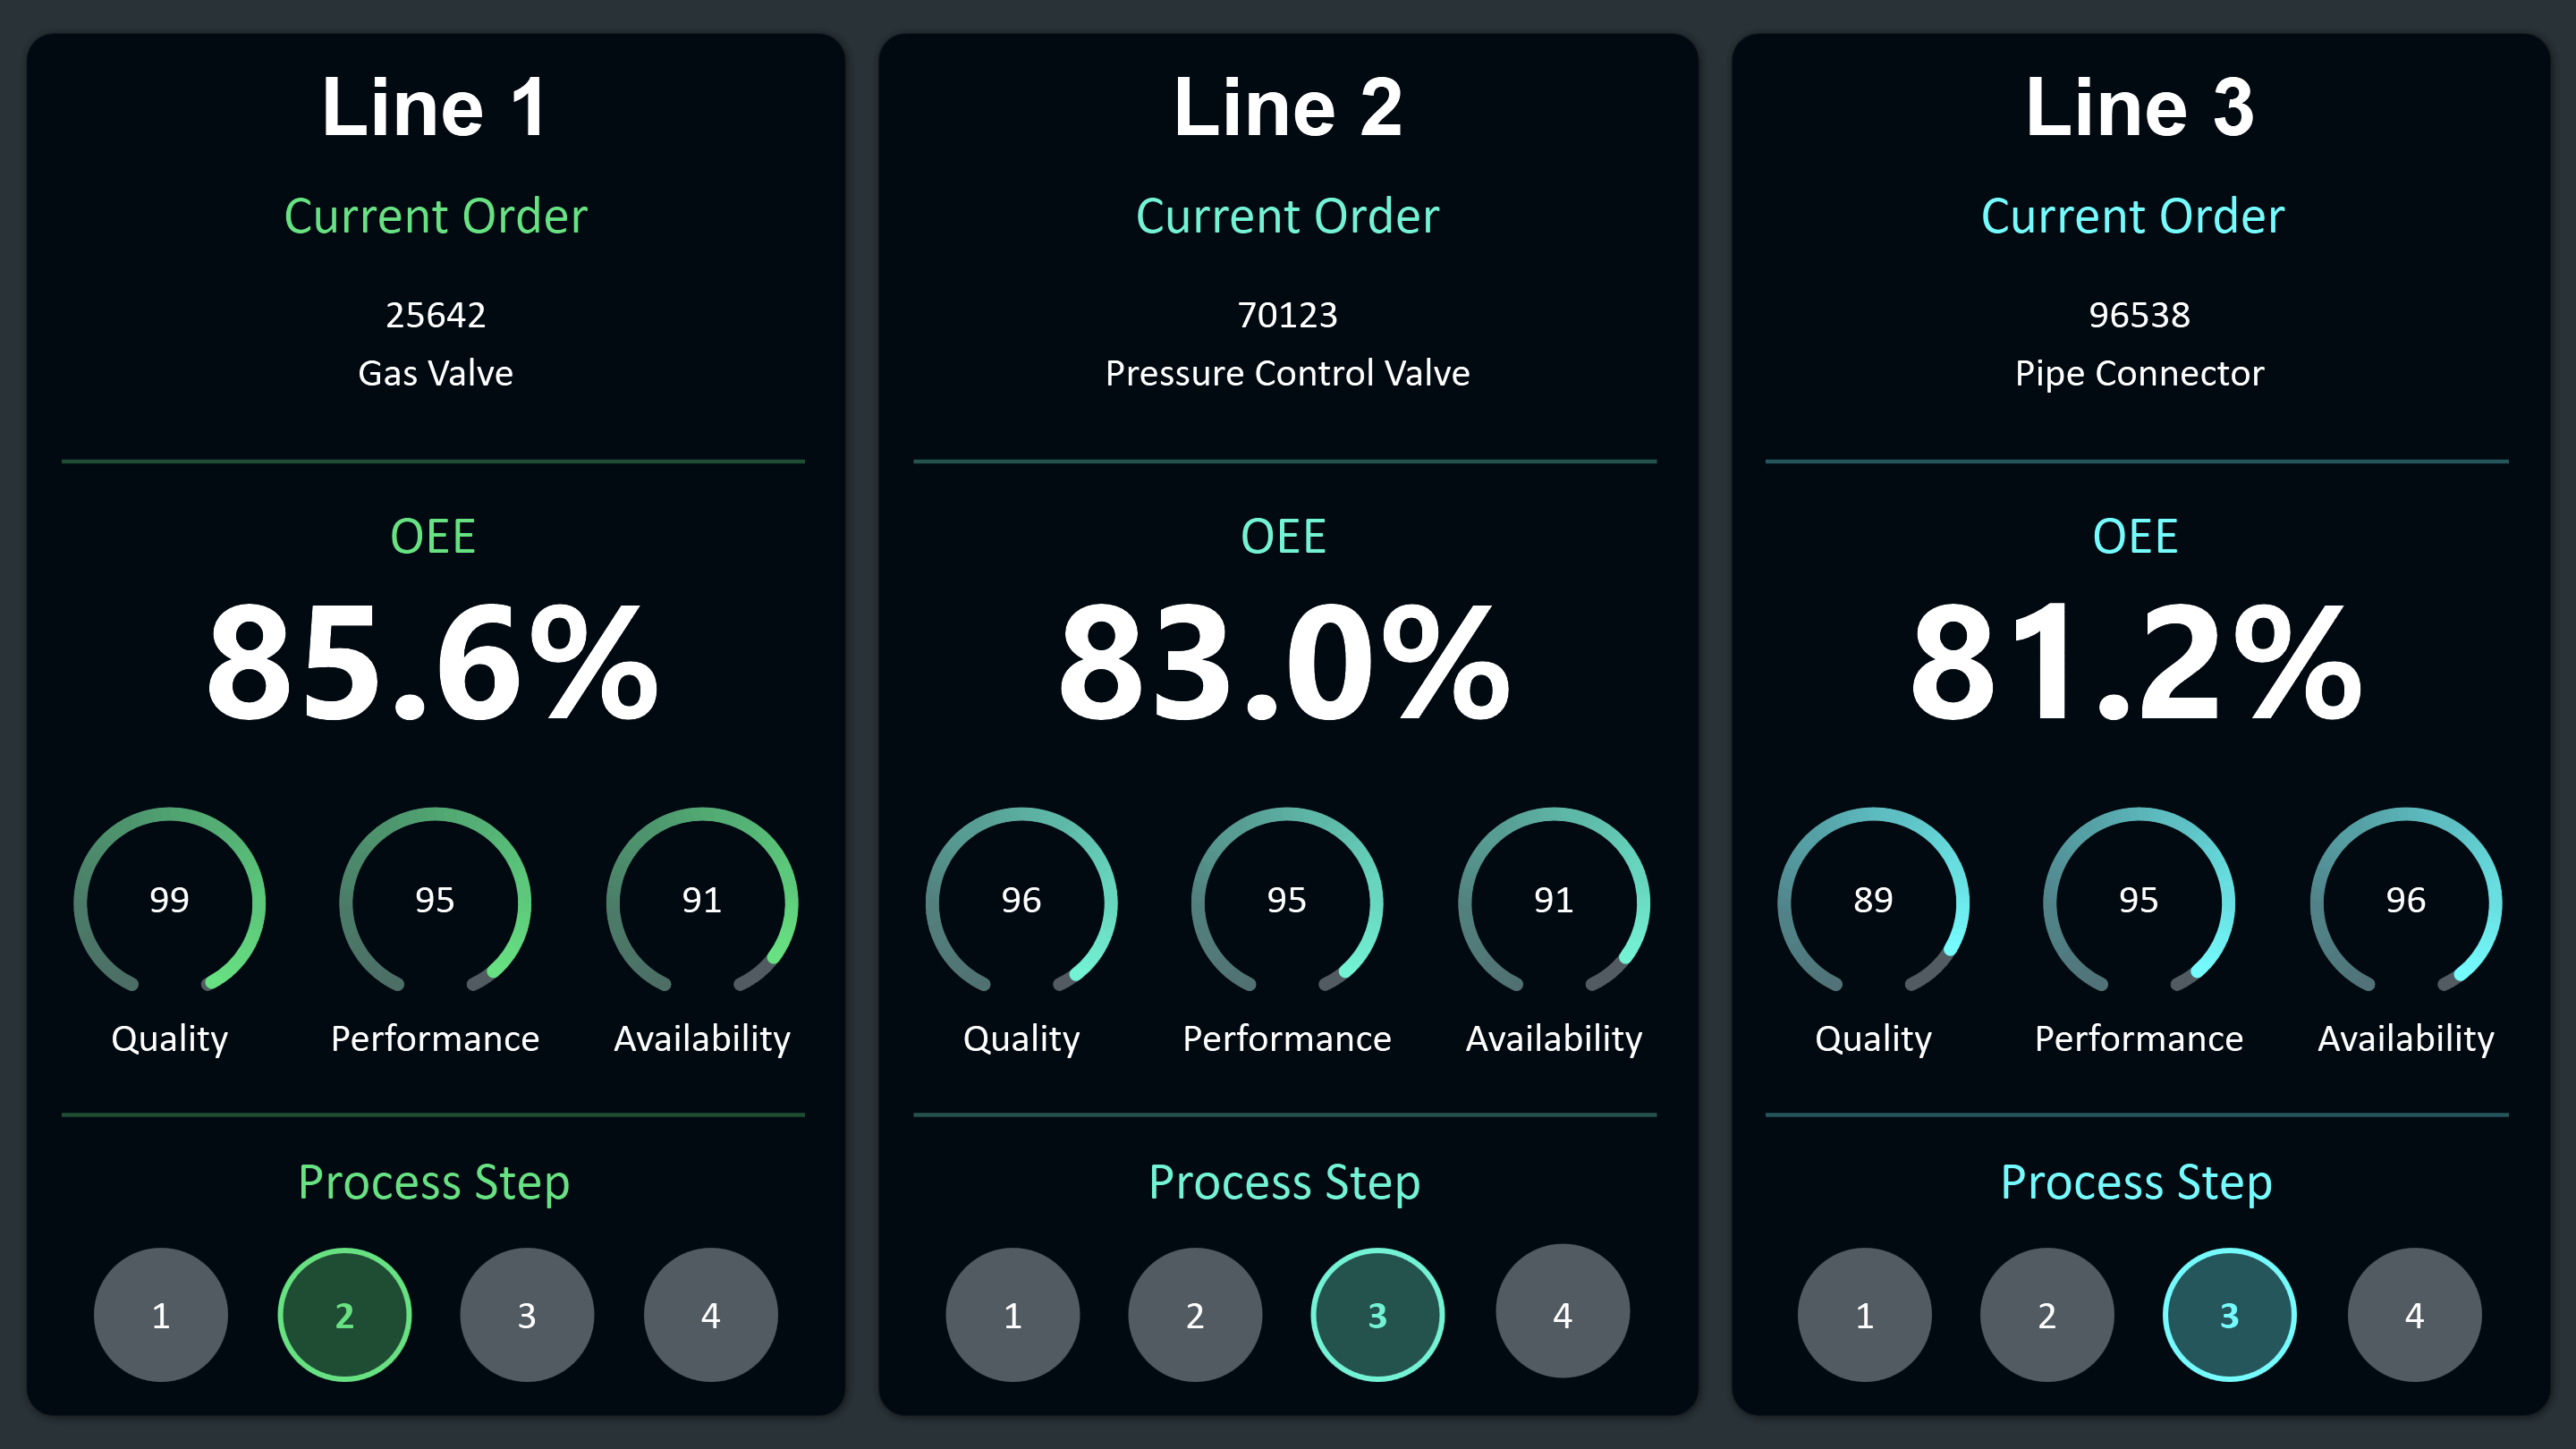
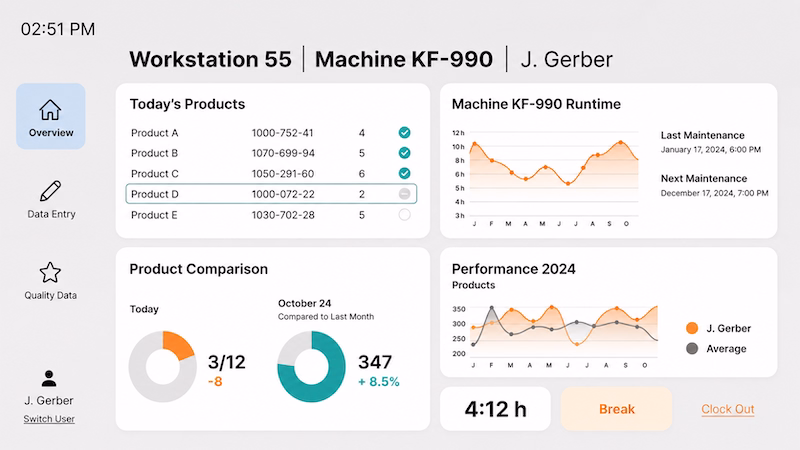
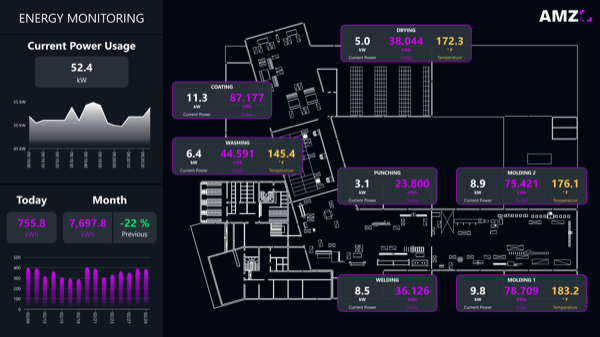
Real-time insights
Different data sources, one central dashboard: Get real-time insights into the status of your processes and system data across the company.

Maximum added value
Increase productivity and ROI with Peakboard and drive digital transformation cost-effectively.

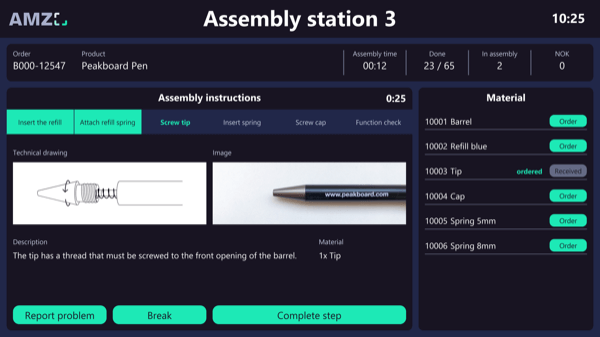
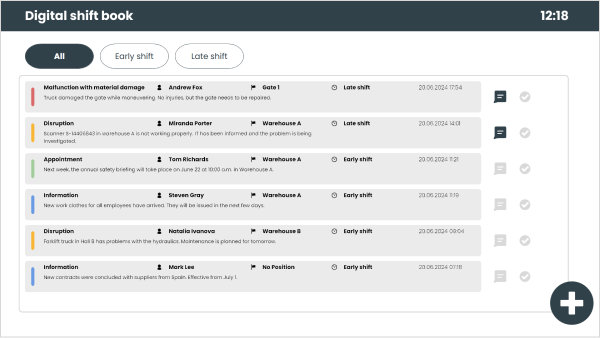
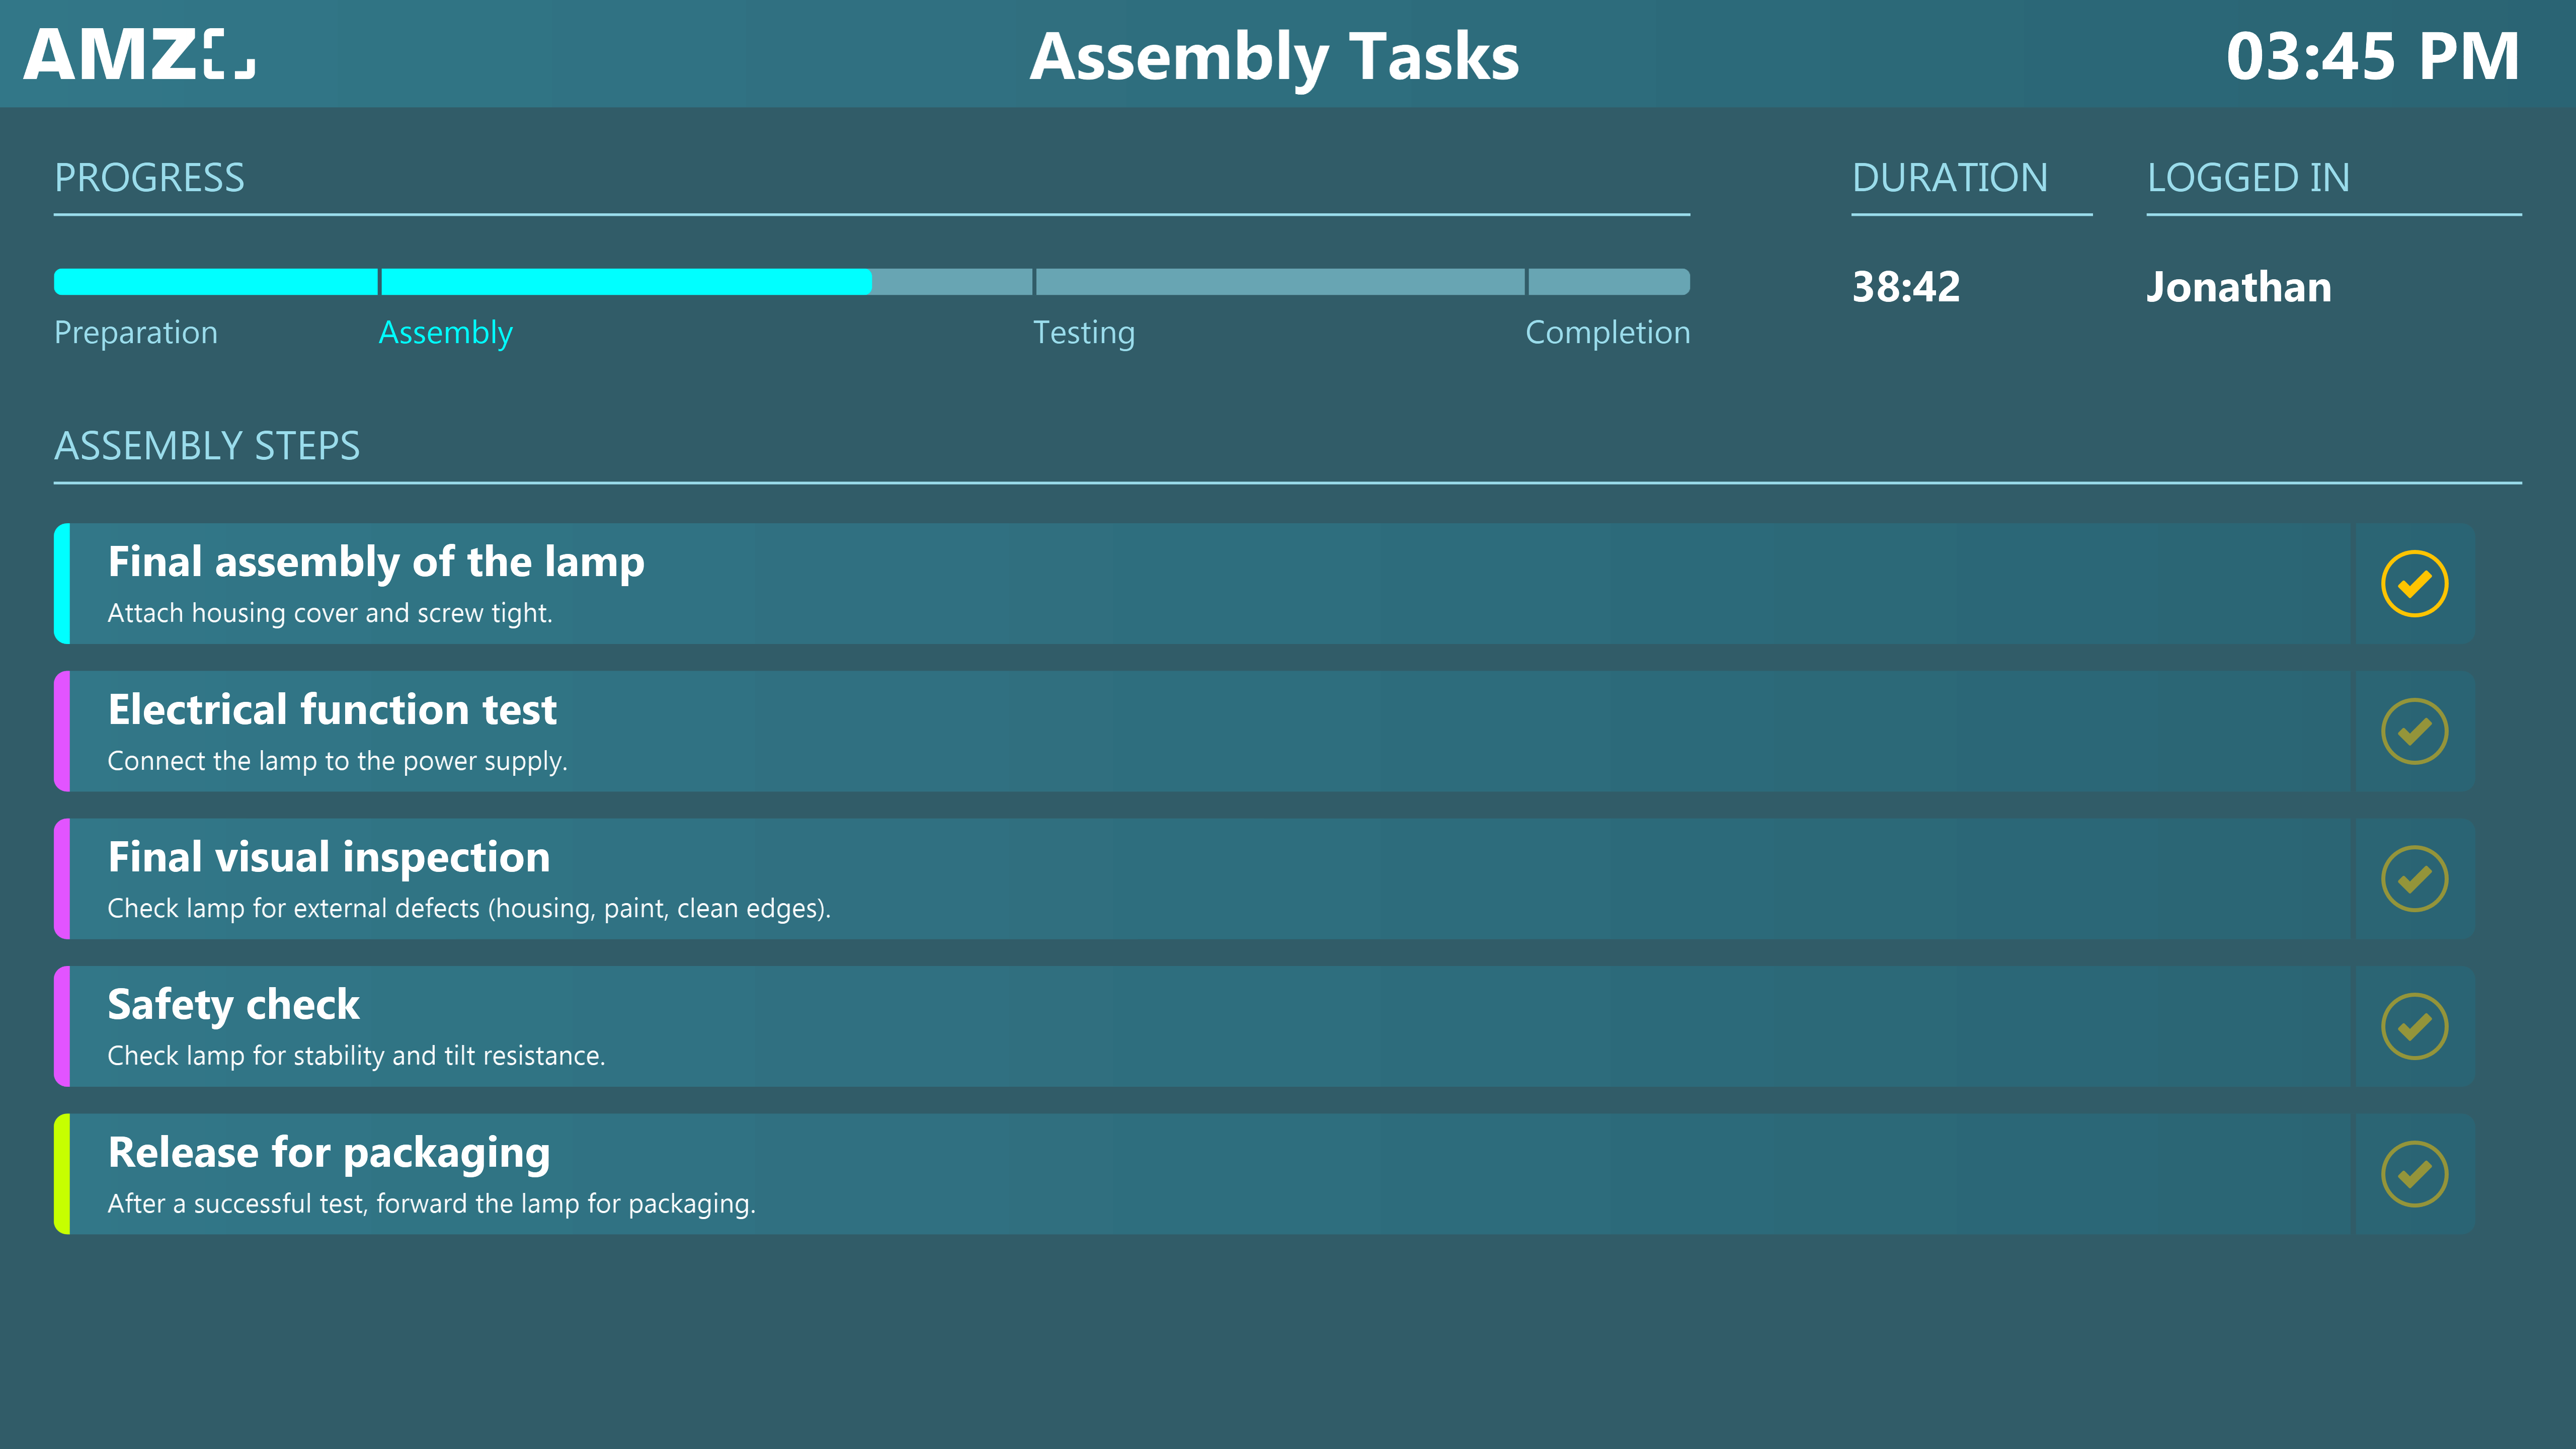
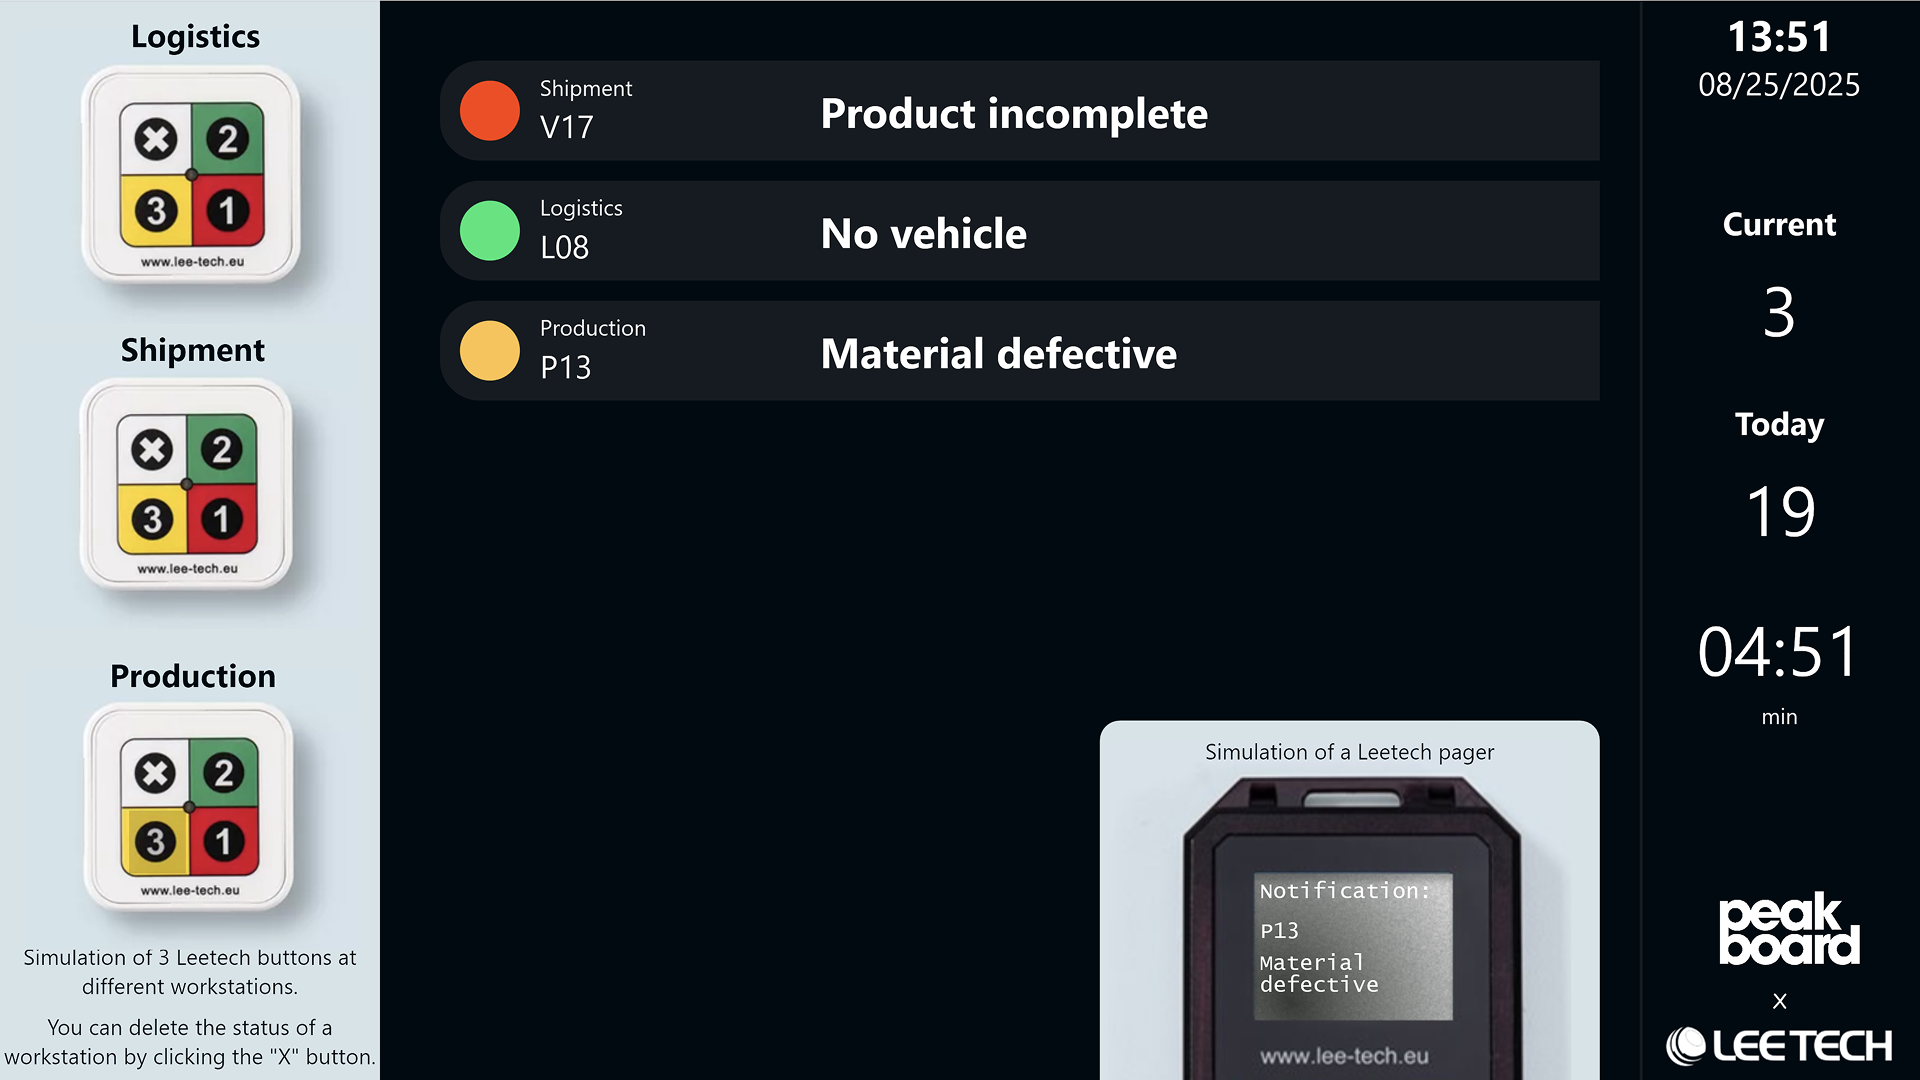
Motivated Employees
Keep your team informed with real-time updates on individual progress, KPIs, and overall processes.

Quick Integration
Ready for use in just a few days – not months. No IT support or programming skills required, thanks to low-code technology.

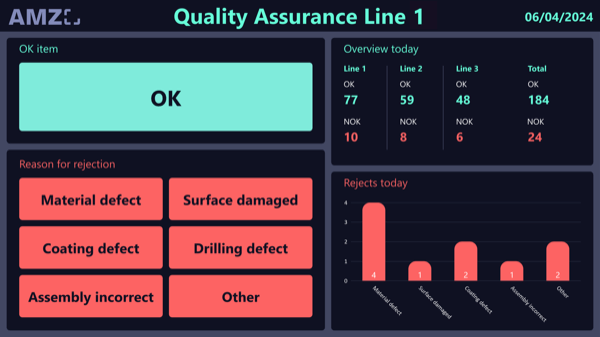
Operational Excellence
Increase transparency with digitized processes and create a solid foundation for continuous improvements.

IT Security
Peakboard runs entirely on your network, ensuring your data remains secure within your company.

All of your data.
One platform.
Peakboard connects your systems and brings all data to one platform — for visualization, automation and individual applications.


%201.svg)


%201.svg)


Solutions for everyone
processes, industries and goals.
Used by industry experts
to cleverly simplify processes.


Start now with Peakboard and simplify your processes
Turn live data into smart decisions — with Peakboard.
