A competitive analysis
What sets apart Peakboard
and Grafana?


Want to get rid of paper reportings?
Here’s how you have all your relevant data in one place to improve efficiency!
Peakboard is an all-in-one solution for your operational data. Communication has never gotten easier with our functionality of collecting data from a wide variety of sources. Simple and customized in real time on displays – exactly where they are needed. Manufacturing managers in the office or workers at individual industrial workstations can make better decisions, optimize processes and control them.
This comparison aims to guide users in understanding the distinct benefits of each platform, tailored to their specific needs—whether for internal data visualization and process management with Peakboard or client-facing engagement and service automation with Grafana.
Competitive analysis.
Peakboard
Grafana
Customer service and comprehensive training program
Simple price structure
Participation in technology ecosystems e. g. Certified by SAP
Full on-prem installation possible
Drag-and-drop application
Try Peakboard Designer now.
Capture, process and visualize your order data e.g. from SAP with the production data from your machine – in real time and without major programming effort.
Just download the software for free, install it on your PC and get started.
"Very flexible and simple solution with wide applications. Used in various areas of production and logistics together with SAP and nonERP data. Fully integrable with many standard interfaces and high flexibility for development. High degree of freedom in the presentation of visualizations."
Martin L.
Head of IT EMEA
"Our department needs data from different systems. With Peakboard, all data sources can be united in one overview. The time saved is enormous, as the data from the upstream systems is syncronized automatically and, above all, live. We can now take action based on the real-time data without wasting time. Easy design of meaningful dashboards on the KPIs that are important to us. Intuitive way of working."
Anela B.
Rev. Acc., Environmental Services
"You can dig into plotting simple data. If you like it a bit prettier, you can also use the countless templates and customize them easily. If you do need support, it is 100% on point and very personally interested. We used to implement wallboards with the help of old Windows laptops. I was thrilled that there was such a super solution for this to be handled more professionally."
Benjamin S.
IT Administrator
"The visualization makes a very professional impression. Whereas Flipchart was used for presentation before, Peakboard now takes over. Up to date and attentive. Overall very good system for visualizing process data."
Christo
BL Germany
"Very clear and tidy software. Administration is clear quite quickly after a few clicks and the software is easy and quick to configure and administer."
Sven
Software developer in Germany
Simple and powerful
Why Peakboard is the better solution.
Reliability
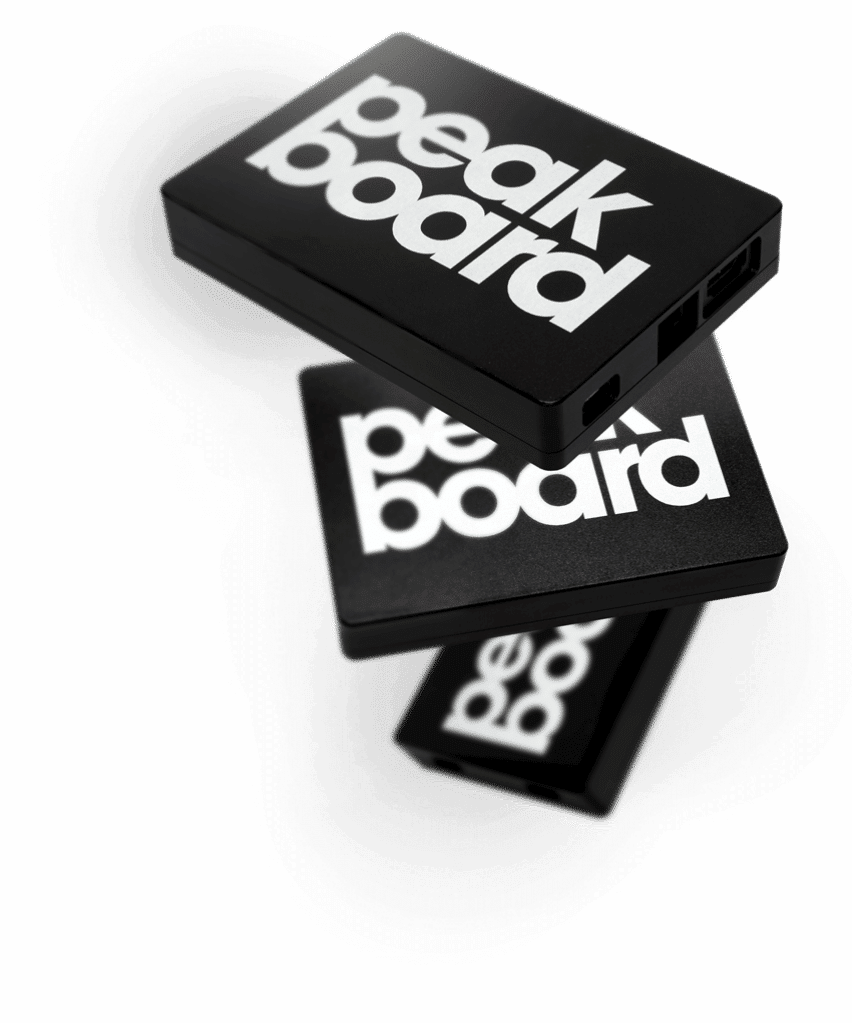
Other than Grafana, Peakboard offers its own hardware devices designed to work seamlessly with its software. Peakboard not only allows you to read, combine, process, and visualize your data. You can also write it back to the source system or share it with your machines.
Grafana is renowned for its reliability in monitoring, visualization, and alerting for diverse data sources, especially in IT and DevOps environments. It’s well-supported, with extensive documentation and a large user community.
User friendly
Grafana is user-friendly, the level of ease can depend on the complexity of the data and the specific requirements of the visualization or analysis. Users with basic IT knowledge can quickly learn how to use Grafana effectively, but more complex setups and advanced features might require a steeper learning curve and a deeper understanding of the underlying data sources and querying languages.
Peakboard offers a user-friendly drag-and-drop interface for designing dashboards and visualizations. If you prioritize ease of use and quick setup, particularly for users without extensive technical expertise, Peakboard might be a more suitable option.
Fast results
One Workshop Day: That’s it. With Peakboard you can optimize your efficiency very easy and experience a ROI of 237 %. While Grafana puts its focus on integration capabilities. A basic implementation with Grafana is really depending on the size of the project but minimum a day or longer. This allows results to be visualized more quickly with Peakboard.
Frequently asked questions
FAQ.
You can interact with you applications via external devices such as a mouse, keyboard, presenter and buttons etc. There is also the option of creating an interactive dashboard via a touch display.
Yes. Peakboard is SAP certified and meets all requirements for successful integration with SAP applications. We have even developed our own interface for this.
Learn more about SAP connectivity here.
You can set this up as you wish. From real time to times between 5 seconds and several days, everything is possible. It depends on the use case and the data source.
Yes, you can also visualize the applications on a screen without using the Peakboard Box. Our solutions are flexible and can also be displayed on a screen using a device of your choice. We have Peakboard BYOD (Bring your own Device), which allows you to purchase a license to run Peakboard on your own device.
There are several extensions for this. We are happy to support you with the connection and find a solution together. Just contact us.
