Based in Rebstein, Switzerland, Aquis Systems AG is an OEM (Original Equipment Manufacturer) that develops and manufactures electronic solutions for sanitary installations in the public and commercial sectors, from complete electronic faucets to water management systems. Components for hydraulics sensorics/electronics, communication (APP to IoT) are also part of the scope of services. Founded in 1995, the company employs a staff of 300 at three locations.
At each of the 15 production stations, a maximum of three skilled workers install sensor-controlled faucets by hand. Each station has a tester that inspects electrical and mechanical components, leak tightness, and the software and hardware of the end product and then transfers the results to an SQL database. The tester then imports the data into an Excel spreadsheet for analysis to optimize processes and improve quality. This is how the company obtains information on statistics such as the production error rate and the output quantity at the end of the day.
“Instead waiting until after a shift to know how much we have produced, we want to know this during the shift so that we can respond earlier,” says Denis Maljkovic, Head of Production and Industrialization at Aquis. “On top of that, Excel-based shop floor management in the morning simply takes too much time. Given the amount of data, an update can sometimes take up to half an hour. The subsequent analysis is also time-consuming because we first have to create the right view. This is where we quickly come up against the limits of our programming skills.”
In some cases, the process may take several hours because the volume of data rapidly increases. Communicating up-to-date information about unit counts and quality to employees soon enough is impossible. Maljkovic has to delegate or automate because his capacities are exhausted.
Maljkovic’s team was able to make two mechanical problems in the inspection process transparent immediately at the start. The previous method reported some manufacturing elements as defective, even though they were not.
The main benefit, though, is a significant increase in the speed of data preparation and the quality of the information.
“What took hours before is now done in real time and is automated,” Maljkovic sums up.
This improves communication with other departments, including those that are only sporadically involved in shop floor management, such as internal sales or executive management. All in all, interest in the order status has increased noticeably since real-time information about production is available.
“Now we communicate very efficiently about why there are which defect rates for which defect types – software, hardware, or mechanical. Information is clearer. Before that, it was all on paper. Going into great detail there was complicated. Now we can clearly show what we are talking about directly on the dashboard without printing it out,”says Maljkovic.
The evaluations provide a common basis for everyone involved so that targeted optimization measures can be identified efficiently while increasing their acceptance.
In an initial workshop lasting around four hours, a dashboard was created and then tested in the day-to-day operation.
“We immediately ran the initial draft in real time to see whether the data was correct,” says Maljkovic. “The productive collaboration was key in helping us build a well-developed dashboard very quickly.”
In a second workshop, Aquis and Peakboard used the findings from the testing phase to finalize the details.
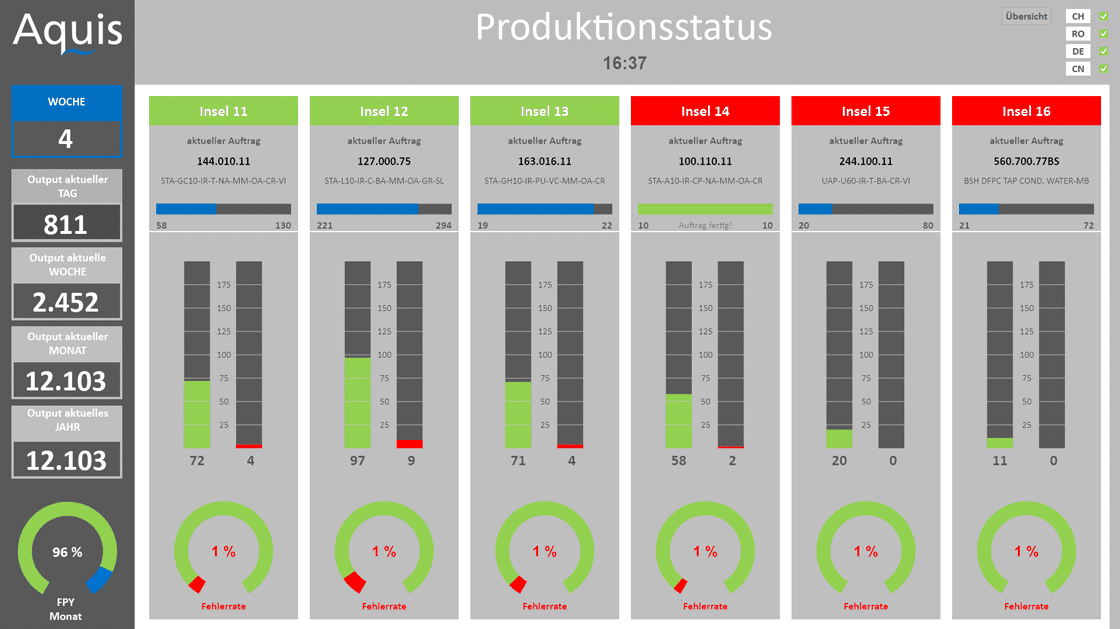
The dashboards visualize daily, weekly, monthly, annual, and real-time output for each location. Along with output, the dashboards show the current orders per production station and the level of achievement, including pass/fail inspections. The company can view the status quo of all production stations as a whole. Plus, it can also analyze each production station in depth to reflect on performance with its team and quality managers. Peakboard’s operational excellence platform accesses the SQL database directly to extract the previously defined data defined.
In the future, Aquis will visualize additional information about each of its production stations, for example. with an Andon Board that displays material availability. Right now, employees still trigger the signal for a material shortage manually, at which point a warehouse worker delivers the goods. This can take several minutes. To decrease this margin, Aquis will first measure the downtime caused by material shortages.
The next step is to show quality at the level of a specific component. Maljkovic explains,
“We now have a lot of ideas on how to digitally record our production, which we are gradually specifying and implementing. Our initial experiences have made us get creative.”
Although the SQL database records data from every location, visualization is currently only available in Switzerland. Yet as soon as all the necessary information has been compiled there, Aquis will also set up Peakboard dashboards at its other locations.