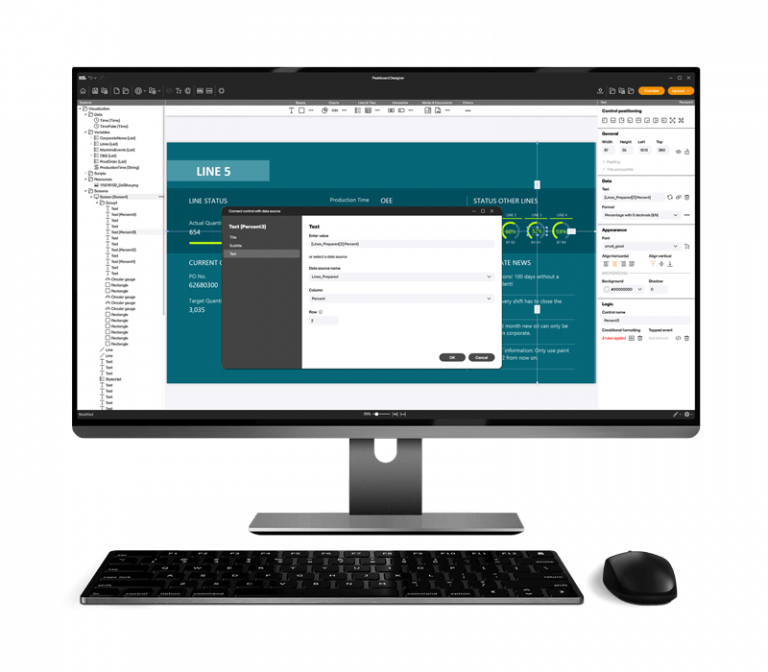
Just-in-time warehouse management depends on processes running smoothly, effectively, and reliably, especially in collaboration with suppliers or dispatchers. This is why data visualization plays a central role, as only processes that can be mapped and measured can be developed and optimized. Providing accurate, up to date information is key for logistics teams to make informed decisions.
With Peakboard, you can visualize the key metrics in real time using customized dashboards. As an all-in-one solution, Peakboard integrates data from various sources for a wide range of use cases. It operates in a decentralized manner, allowing each dashboard and work station to function according to its unique logic and display only the data that’s needed. This agility allows adjustments to be made to individual dashboards as needed. Pretty smart, right?
Discover a wide range of available dashboard templates on our Templatesite
Peakboard helps you to communicate relevant information quickly and clearly from the RFID system to your logistics team. Display information regarding dispatch, target tables, or the current weight on the loading ramps. Sound the alarm for loading errors or overloading. And all in real time. This empowers every logistics employee to make decisions about what needs to be done now. Plus, Peakboard takes the information directly from your warehouse management system or from the data sources systems of your suppliers. It’s your choice!
Capture, process and visualize your order data e.g. from SAP with the production data from your machine – in real time and without major programming effort.
Just download the software for free, install it on your PC and get started.
