Shop floor analysis with
Microsoft Power BI.

Analyzing shop floor data

Solution at a glance.

Problem

  • Lack of transparency of shop floor data
  • Delayed information

Solution

  • Analysis of shop floor data with Peakboard Box and Microsoft Power BI
  • Collect shop floor data centrally, store it and use it in Peakboard Hub as a central database

Result

  • Detailed insight into historical shop floor data and Power BI analysis
  • Respond flexibly to process changes and new requirements

From analyzing shop floor data to operational excellence

Operational excellence through detailed data analysis.

Operational excellence aims for a company-wide increase in effectiveness and efficiency. Processes and systems throughout the company should be continually optimized in order to reduce loss and waste. As a result, productivity and quality increase while costs decrease. Process management is an essential component of operational excellence in a company.

read more

What does operational excellence have to do with Peakboard?

Process management means that process data is analyzed for abnormalities and optimization potential in order to derive recommendations for action. In order to perform the analysis, the processes must first be transparent.

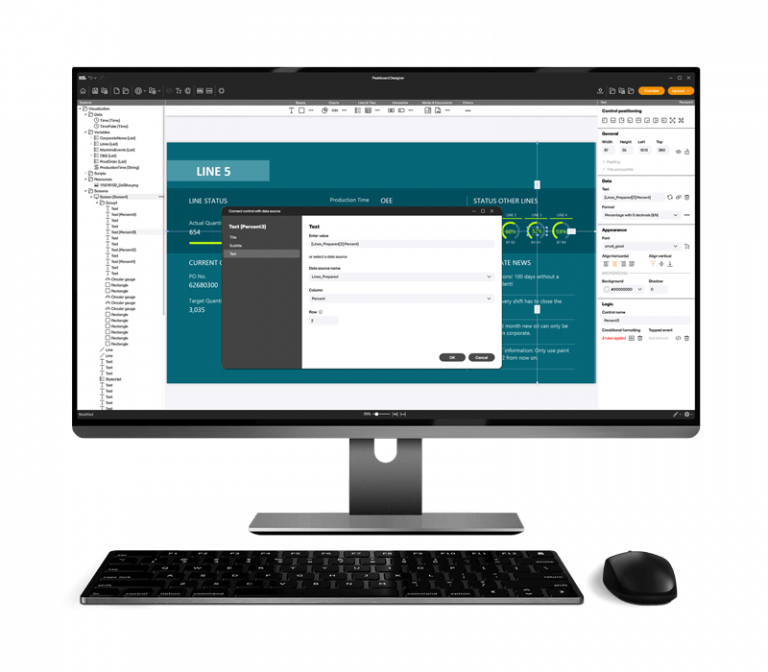
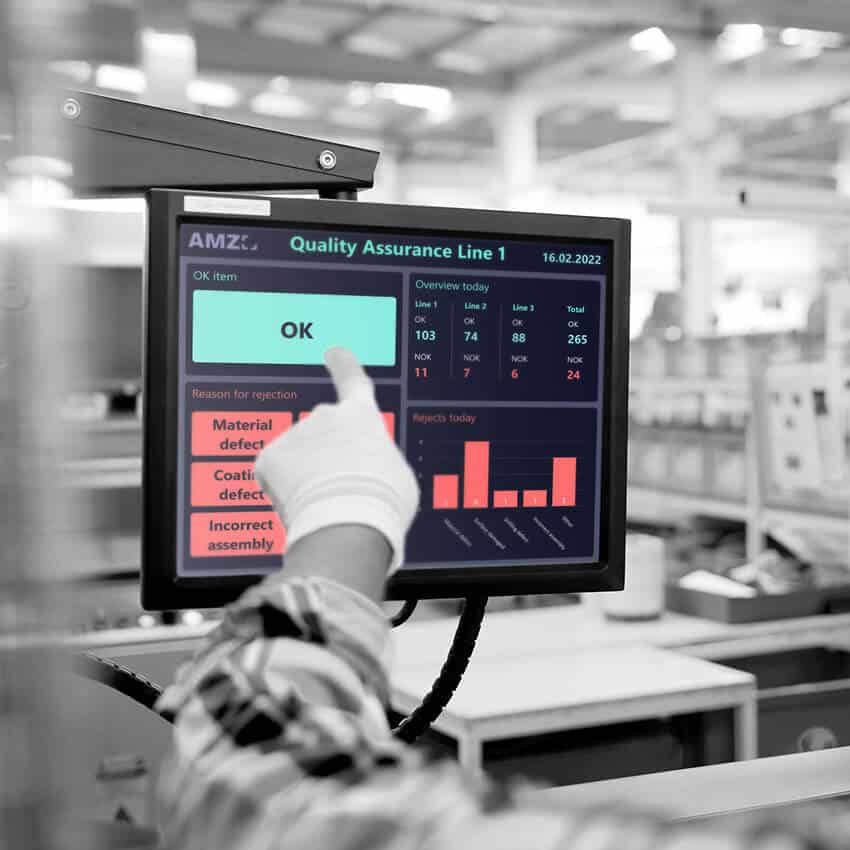
With Peakboard, you not only make your current processes visible in real-time and therefore optimizable. You can also write your shop floor process data in Peakboard Hub as a central database for further analysis, no matter whether it is collected manually via production data acquisition or automatically via PLC or MQTT.

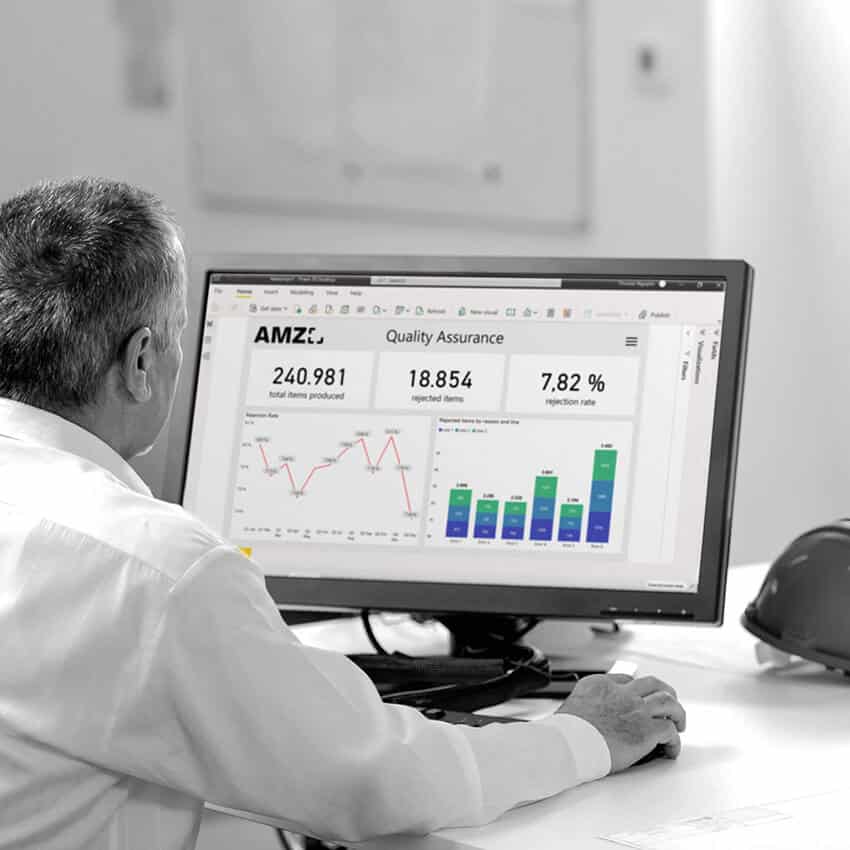
To analyze your persistently stored shop floor data, you can use the business intelligence tool Power BI from Microsoft which you easily set up on the existing database in Peakboard Hub.

In conjunction with MS Power BI, Peakboard gives you the ability to capture, store, and evaluate your shop floor data professionally and easily. After all, transparency about your shop floor data is what ensures operational excellence in your company.

read more

Discover a wide range of available dashboard templates on our Templatesite

Quickly implement your own analysis requirements

Easy data collection with Peakboard and analysis with Power BI.

With Peakboard Box, Peakboard Hub, and Microsoft Power BI as an integrated system, you have everything you need to analyze your shop floor data quickly, easily, and customized to suit your requirements. Depending on your use case, Peakboard offers you a variety of interfaces that allow you to visualize data from a wide range of sources on your dashboard. This not only enables you to easily connect already existing data, such as from your PLC, but also to capture new data through production data acquisition or by retrofitting your machines.

To analyze the generated data, you simply save it centrally with Peakboard Hub and then evaluate it flexibly in Power BI.

This gives specialist departments a simple edge computing solution to create quick analyses directly and implement new requirements immediately and independently.

read more

The software

Peakboard Designer.

Capture, process and visualize your order data e.g. from SAP with the production data from your machine – in real time and without major programming effort.

Just download the software for free, install it on your PC and get started.

You have some questions?

Then let's talk.

Write a message

Leave us a message
and we will get back to you!

Call us

Whether technical or general questions,
you can reach us between
9 am-12 pm and 1 pm-5 pm (CET).

Online Demo

Are you interested in an individual free live presentation of our solution?