Complaint analysis & fault analysis Logistics: Data-driven optimization of processes
Complaint analysis and fault analysis in logistics are crucial for continuously improving processes, reducing costs and sustainably increasing customer satisfaction. Today, digital solutions enable companies to identify problems early on and solve them permanently.


Reklamationen gezielt analysieren und dauerhaft reduzieren
Nutze die Kraft datengetriebener Reklamations- und Fehleranalysen, um deine Logistikprozesse transparent und effizient zu gestalten. Peakboard bietet dir die digitalen Tools, um Fehler schnell zu erkennen, proaktiv zu beheben und Kundenzufriedenheit nachhaltig zu verbessern.
Challenge
- Unclear reasons for complaints
- Delayed response times
- High costs due to recurring errors
Solution with Peakboard
- Real-time dashboards for transparent complaint analysis
- Digital fault identification in logistics
- Proactive error prevention through rapid data analysis
Result
- Significantly fewer complaints
- Faster, targeted action in case of errors
- Higher customer satisfaction and reduced costs
Fully adaptable to your needs
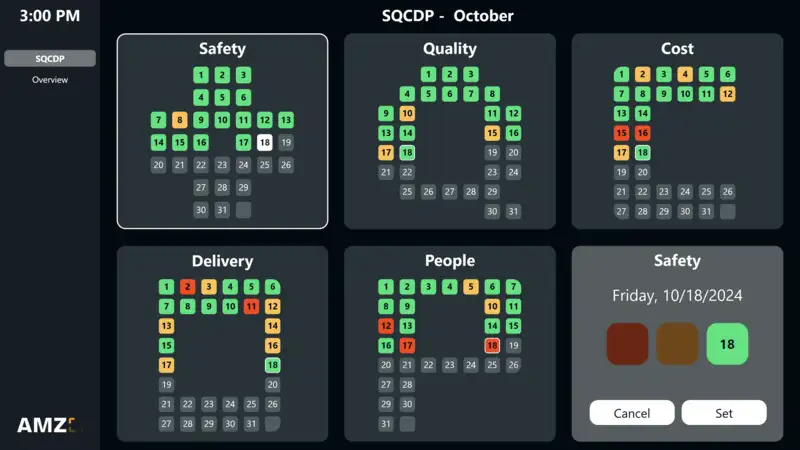
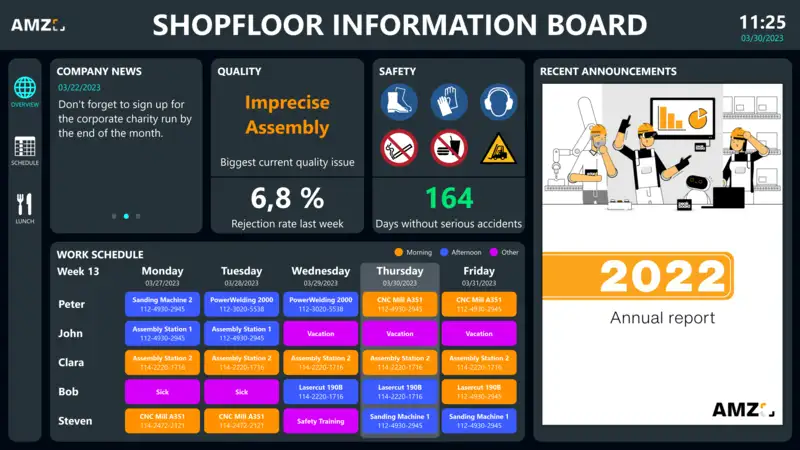
Shop Floor Management
As flexible as your processes.
With Peakboard, you create a centralized and flexible solution for your daily shop floor communication – perfectly tailored to your individual workflows.

- Standardised SQDC reports for a quick overview of the regular meeting
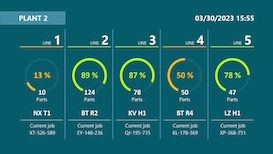
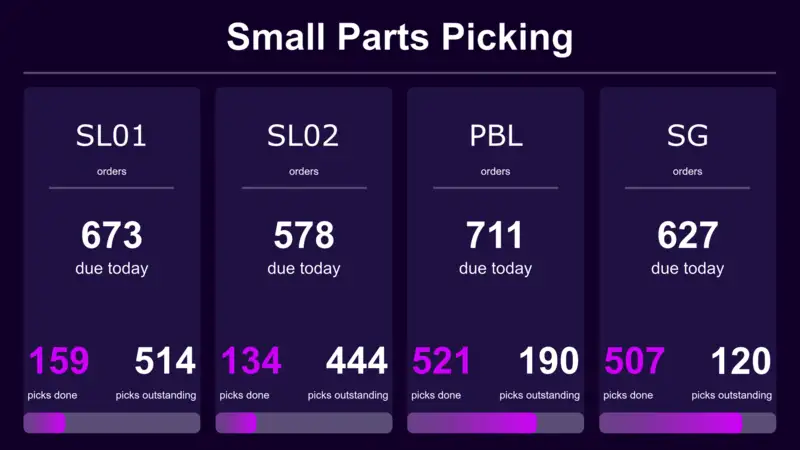
- Define your own key figures – manually or automatically
- Capture, edit, and track measures — structured and team-oriented
- Assign responsibilities with notifications via email, MS Teams, or Slack
- Adjust menu structure and content to fit your department’s needs
- Store historical data and analyze it with Power BI, QlikView, or Tableau
Discover how flexible shop floor management can be with Peakboard

All of your data.
One platform.
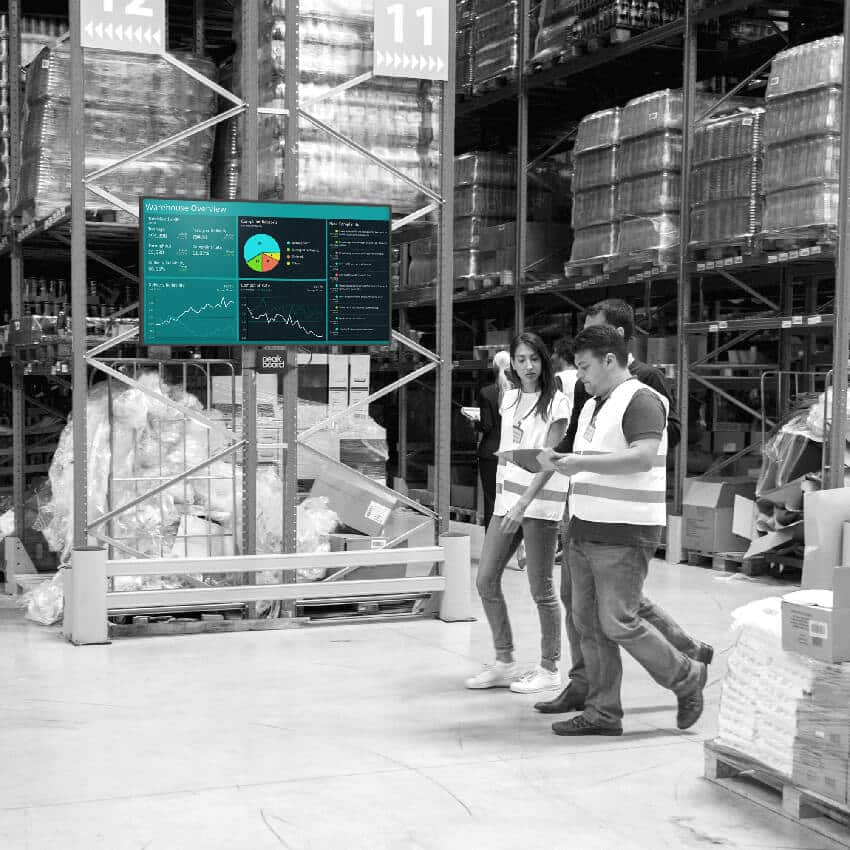
Peakboard connects your systems and brings all data to one platform — for visualization, automation and individual applications.


%201.svg)


%201.svg)


How to bring transparency and speed to your processes in 30 days
Implementing new software shouldn't take a year.
Get started for free with Peakboard Designer
Create your digital complaint and fault analysis to optimize logistics processes and process complaints faster. With our template, you can identify sources of error in real time, act data-driven and sustainably improve your processes — without any programming knowledge.
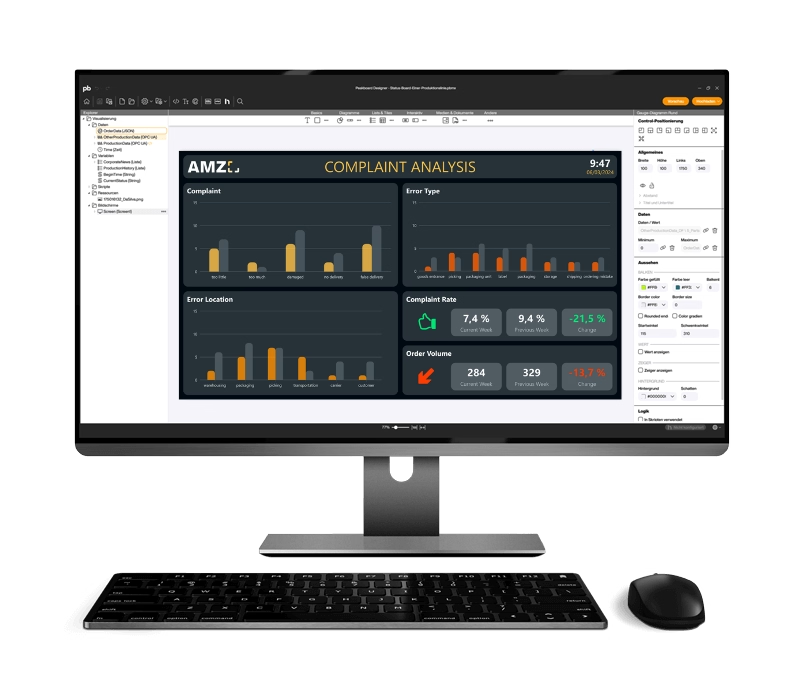

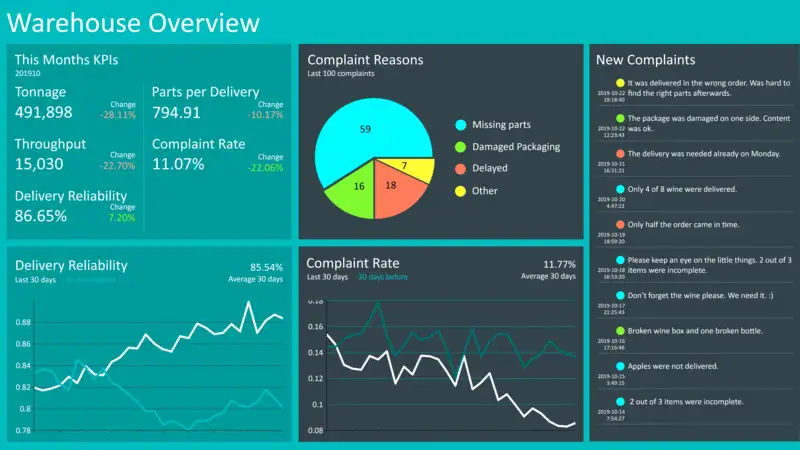
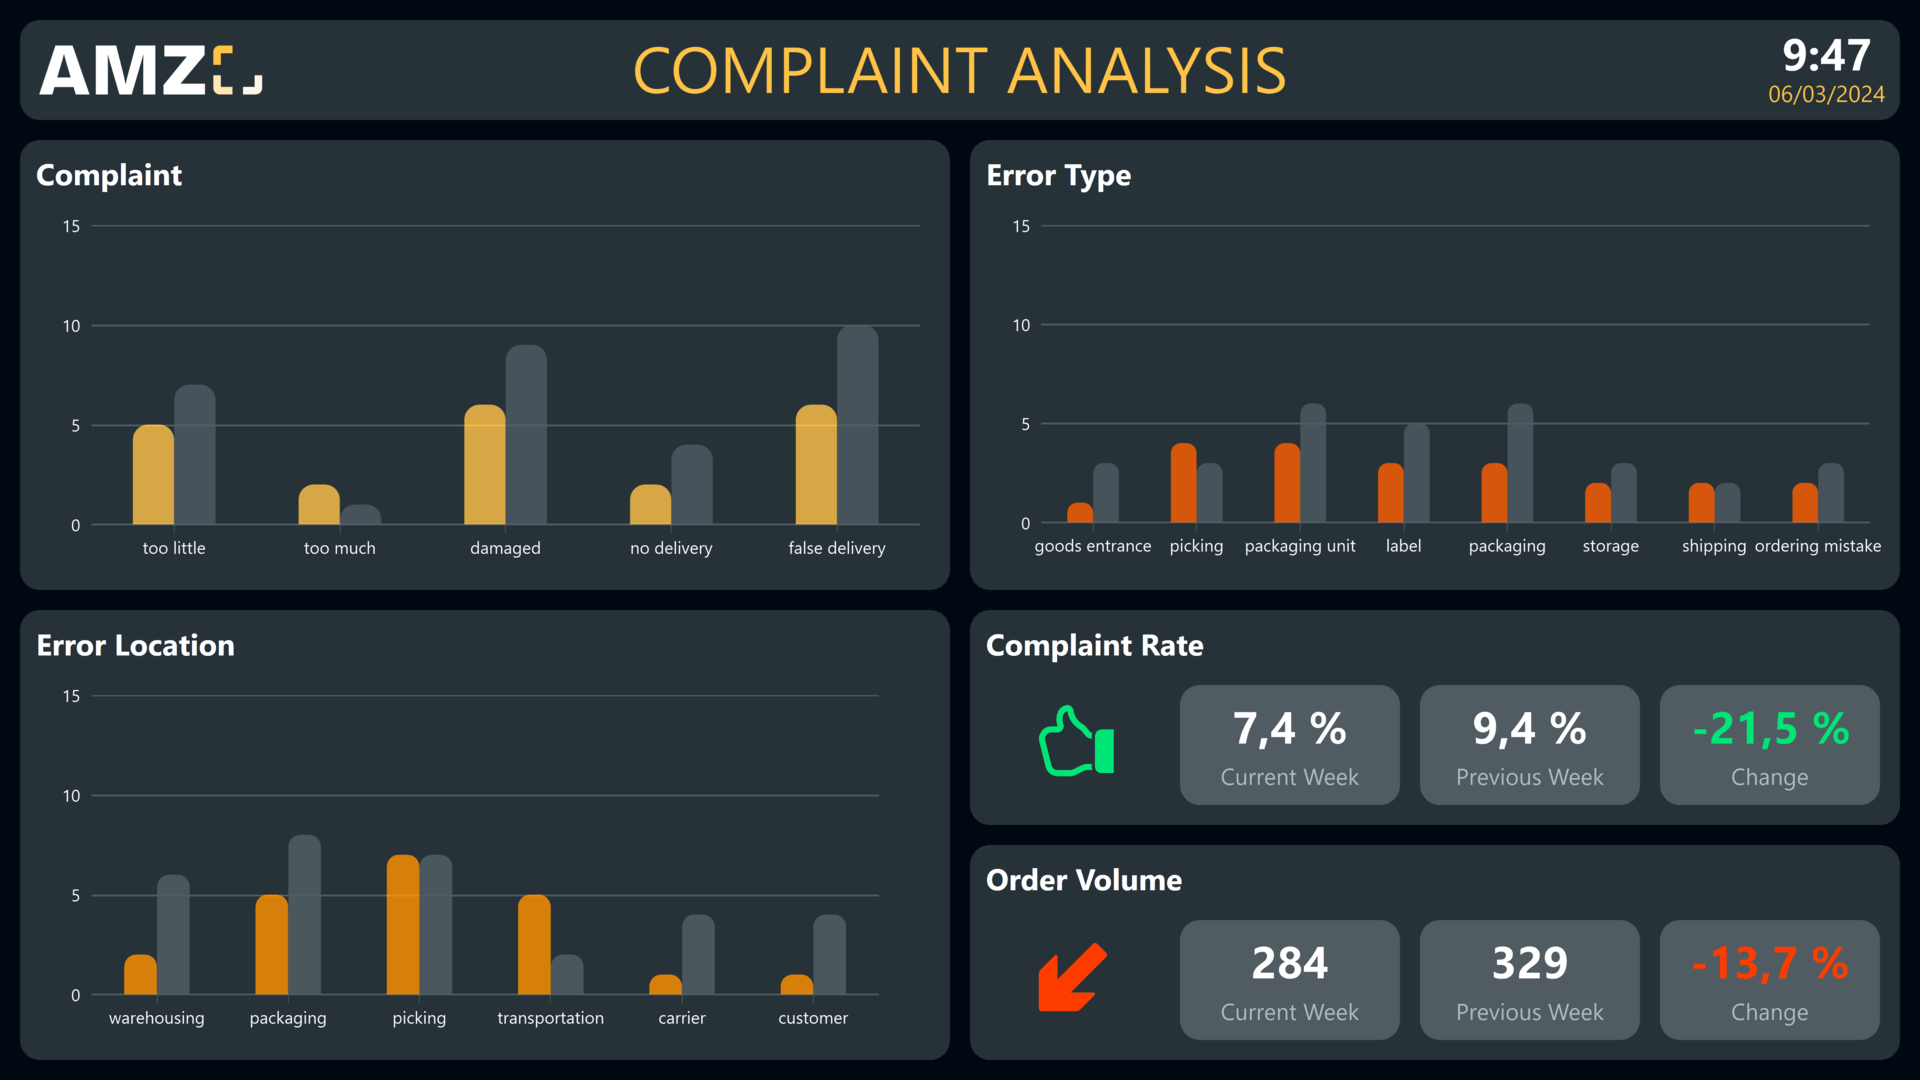
Every day, modern companies are faced with the challenge of handling customer complaints quickly and effectively. Peakboard's digital complaint analysis makes it possible to identify sources of error in real time and eliminate them immediately. This creates transparency, reduces complaint rates and ensures smooth processes that lead to higher customer satisfaction.
Peakboard offers a powerful solution for error and complaint analysis that helps companies optimize their logistics processes:
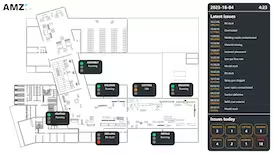
- Real-Time Dashboards: Errors and reasons for complaints are immediately identified and transparently visualized so that you can react quickly.
- Proactive error prevention: Data-driven decisions enable rapid intervention and sustainable optimization of logistics processes.
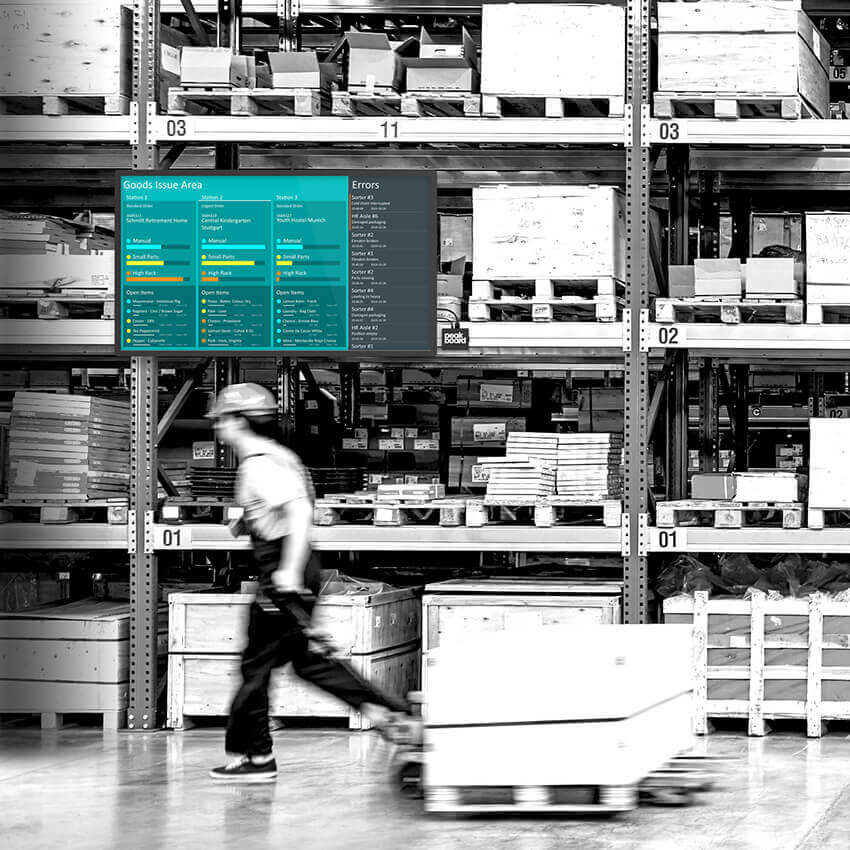
- Seamless integration: Peakboard can be easily integrated into existing systems such as ERP, CRM and supply chain management to ensure precise analysis and seamless processes.
With Peakboard, complaint and fault analysis is digitized and optimized. Here is how it works:
- Real-time digital dashboards: All relevant complaint and error data is immediately visible and enables a quick response to problems.
- Data-driven decisions: The real-time data supports proactive error prevention and enables continuous process improvement.
- Integration of existing systems: Peakboard is easy to integrate into existing IT systems and ensures efficient collaboration between different departments and systems.
Peakboard offers a user-friendly and flexible solution for complaint and error analysis, which is perfectly integrated into existing business processes:
- Flexibility and adaptability: The solution can be easily adapted to the individual needs of the company and to the existing infrastructure.
- Real-Time Visualization: All relevant fault data is immediately visible and enables rapid analysis and resolution.
- Easy integration: Peakboard can be seamlessly integrated into existing systems such as ERP, CRM or supply chain management, so that the entire complaint process is optimized.
- Continuous process improvement: By continuously recording and evaluating error data, companies can systematically learn from their mistakes and sustainably improve their logistics processes.
Used by industry experts
to cleverly simplify processes.

“Easy implementation and use was important to us. Peakboard offered many standards in the SAP environment and was able to integrate all data sources without programming effort. In addition, even before making the decision, I noticed that we could use the graphical interface intuitively and easily adapt it. ”
Save time with our templates
No time for long designs? No problem: Use one of the many ready-made templates for dashboards and applications — e.g. for production monitoring, warehouse management or quality assurance. Pick a template, customize it, and you're done.